Don’t let the record-breaking stock market, massive government spending, and glutinous money printing make you think the economy is doing great. Rest assured it is not.
Depending on where you live in the world, most small businesses are shut down and most will not come back. Small to mid-size businesses make up 45% of GDP in the US.
According to the January 2021 ShadowStats Alternate Unemployment Report, unemployment is at a whopping 25.7%, here in the United States.

The New Great Depression: Main Data Points
In his new book, Jim Rickards compares the Great Depression 2.0 with the original from the 1930s. The chart below displays global exports as a percentage of GDP from 1920 to 2014.
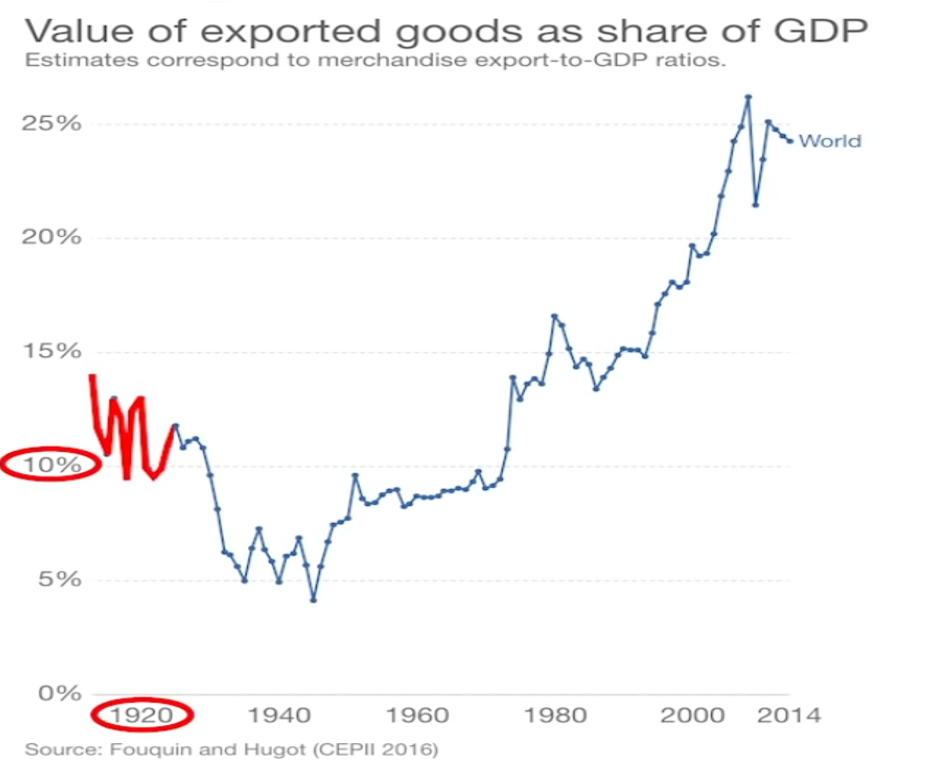
Please keep in mind that back in the first half of the 1900s we didn’t have the global supply chains that we do today. We were not the interconnected global economy as we are now.
In the 1930s, exports as a percentage of the GDP went down by at least 50%.
To give an apples-to-apples comparison, if we were globally exporting 100 barrels of stuff in the 30s, then today it would be 45 fewer barrels.
Global exports decreased 5% during the 1940s and then recovered after WWII. Then exports rose after the 2000s due to globalization and emerging markets like China.
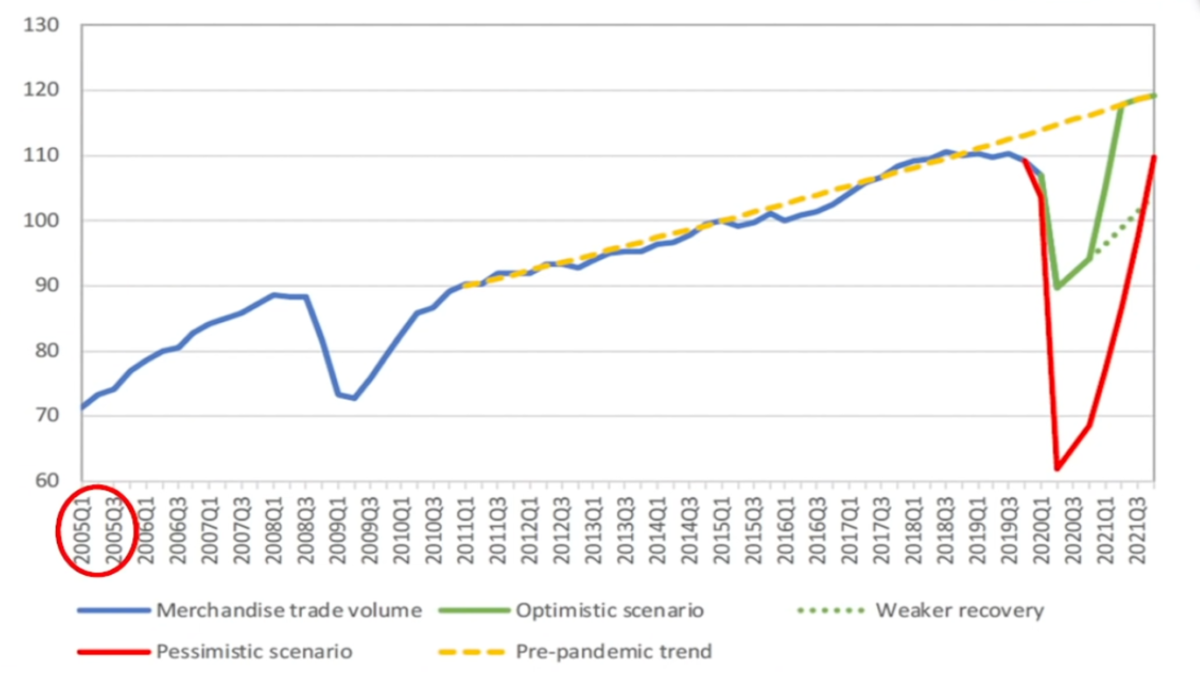
Global trade decreased during the GFC, as shown in the image above (2008Q3).
However, the historic global trend line (blue line above), differs from the trend line of the Great Depression 1.0 (shown in the exports as a percentage of GDP graph, below) because the blue line (above) of the World Trade Index continued increasing.
Then in 2019, the line dropped, most likely because of the trade war and new tariffs the US had with China. In 2020, Covid-19 showed up and reduced trade down from 110 to 60 index points.
If the points were counted as barrels of stuff, then we would have a decrease of 55 out of 100 barrels, very close to the first Great Depression.
Rickards disagrees with the V shape recovery projection in the Index of World Trade graph above, especially when it comes to the real economy in the United States.
His main argument is that we will see regular high unemployment rates. He stated that small and medium-size businesses are 45% of US GDP. Hundreds of thousands of businesses have closed their doors and will never open again.
In a recent interview with Keith Mccullough, he mentioned that Apple, Amazon, and Costco are not getting locked down, but bars, restaurants, and nail salons are. They don’t have $5 million of working capital to sustain the current lockdowns, as they make money, pay their bills, and hopefully pocket a small profit.
These kinds of businesses typically have between 30 and 90 days of working capital, which they've depleted. So now they are going bankrupt.
Jim Rickards also talked about labor force participation. At least 10 million people between the ages of 25 and 54 don’t have jobs. They are also not counted as unemployed due to lockdowns.
The graph below represents the number of jobless claims between 2009 and 2021. They go from 0 to 7 million.
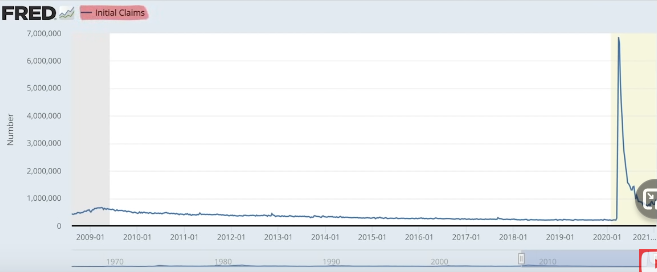
At its worst point during the GFC, jobless claims rounded 600.000. During Covid-19, that number went up to 7 million jobless claims. Then claims came down to 900,000, more than the GFC.
On a per-capita basis, we are much poorer and we have fewer jobs. That is why we are in the Great Depression 2.0.
How Will The US GDP Look In The Future?
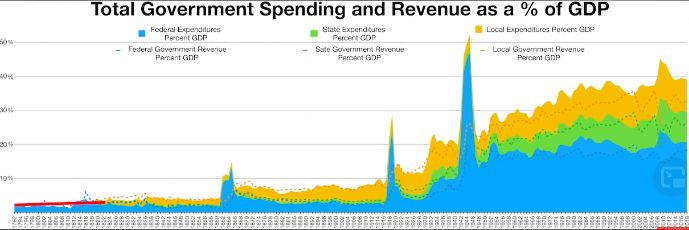
From 1792 until before the Civil War, government spending was very low. During this time, there was also a free banking system in place. After the Federal Reserve was created in 1913, the spending increased to 30% and then 50% after WWII.
Milton Friedman said there is nothing more permanent than a temporary government program. George would also add that there is nothing more permanent than increased government spending.
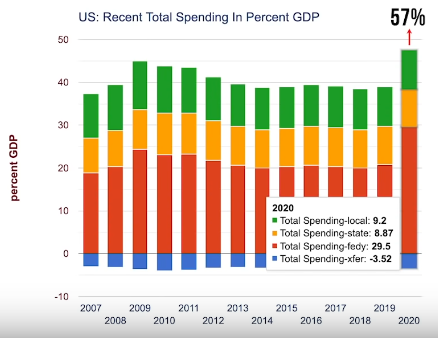
With the surge of Covid-19, Government spending increased by 57% of GDP. In other words, Government spending is responsible for almost 60% of the economy in 2020.
This means the private sector is only accountable for 40% of GDP.
Before the Fed existed, the private sector was responsible for 93% of GDP.
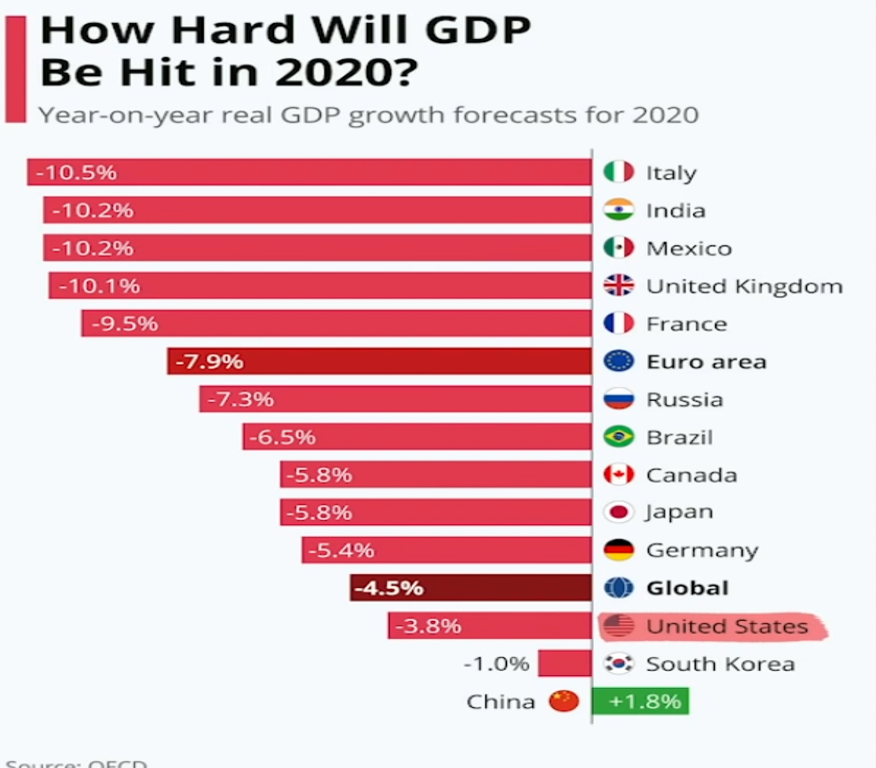
The statistics below show the US GDP decreased by -3.8%. Not because the economy was doing great, but because the government spent a lot of money to keep the GDP afloat.
The more money that the Government spends, the more it distorts the economy, creating malinvestment and a misallocation of resources.
The government cannot produce goods and services, that is a task for the private sector.
Now, what is a depression? Does GDP need to decrease substantially in order to declare the economy a depression or is there more to it?
We need to focus on private-sector GDP because the wealth of a society is measured by the number of goods and services it can produce efficiently.
But since the government is unable to do this, it has to be a task for the private sector. This is why we need to focus on the GDP of the private sector, which currently sits at -20%.
Will Depression 2.0 Be Deflationary Or Inflationary? This Is How You Should Set Up Your Portfolio
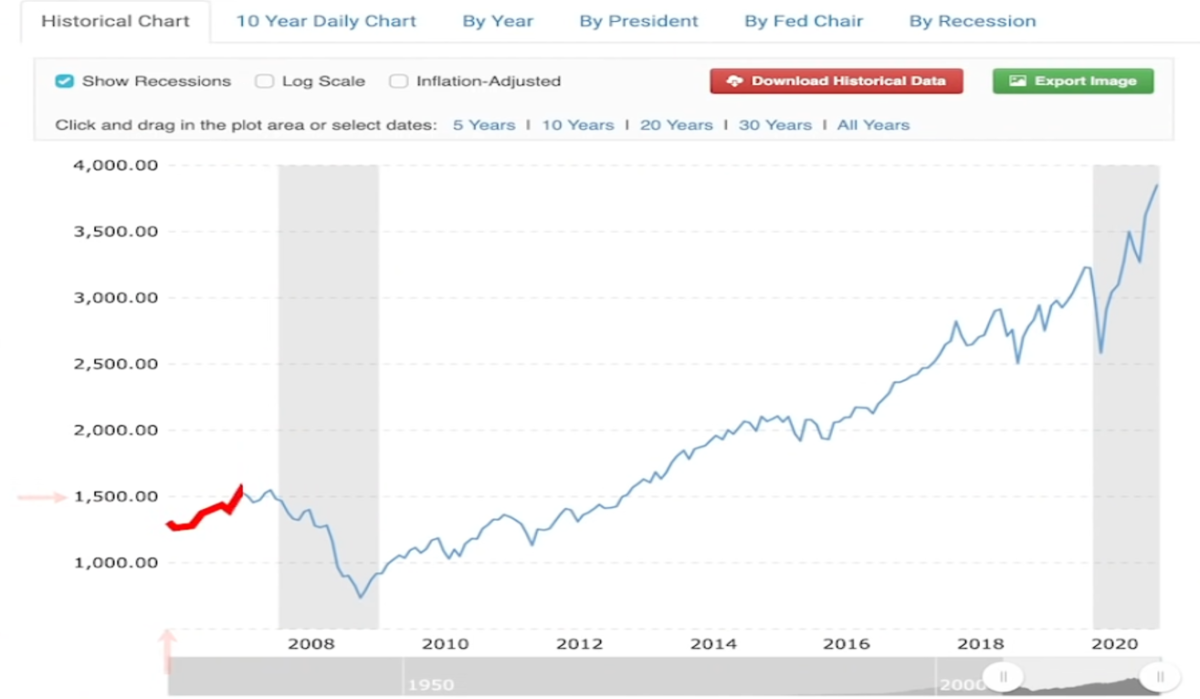
The S&P 500 chart above goes from 2006 to 2021. On the left, it goes from 1,000 to 4,000.
Between 2007 and 2008 we were in the eye of the storm, according to Jim Rickards.
The stock market crashed and we experienced a housing bubble burst. Today, we are in the eye of the storm once again as a result of Fed-induced Government spending and money printing.
As a consequence, the stock market will eventually come crashing down. Historically, the US stock market crashes when confronted with an economic depression.
However, this is not the case today. The stock market has gone up instead, and no longer has anything to do with the real economy.
As Rickards says, the stock market and real economy are now divorced.
In his book, Rickards predicts that by 2021 or 2022 the S&P 500 will drop to 1,570. This is a staggering number when considering the enormous number of people with 401Ks and other retirement accounts.
Not to mention, speculators in the stock market and retail investors are also at risk.
Jim Rickards predicts the situation is getting worse. The CPI will turn negative, as it did in 2008, then we will see deflation.
Rickards also emphasizes that the key to deflation is velocity. He understands the Fed is monetizing all debt and if nominal GDP continues decreasing then so will velocity.
Meanwhile, the Fed continues to produce more currency units. Ultimately, velocity will speed up again and take us into severe inflation.
What are Rickards Portfolio Recommendations?
Stay away from commercial real estate, stocks, and corporate bonds. Think about buying residential real estate, gold, and treasuries. He sees interest rates going lower and the Fed might not take negative rates. The yield curve will probably flatten as well.
What about the dollar in the future?
In 2021, Jim sees the dollar rising against other foreign currencies. In 2022, he thinks the dollar will crash down against goods and services and the DXY.
Make sure to click play above for a more detailed understanding of what might be coming next.