Coronavirus has been around for a long time now. But, are you prepared, not just for a downturn, but a possible coronavirus pandemic type of downturn where inflation and deflation hit the economy at the same time?
I know this question brings up many more like: What will also happen with the price of gold?
You may think that with all the fear in the market over the coronavirus, and the collapse the stock market had in March, the price of gold would soar.

But instead, it dropped. Severely.
Yet, it's back up now, but what happened? Why did gold do the opposite of what it's supposed to? Has this ever happened before?
The questions keep coming…
In this article, I will reveal the biggest economic coronavirus news nobody is talking about:
- How the coronavirus has and will create huge supply shocks.
- How the coronavirus will create huge demand shocks.
- What's in store for the price of gold?
The Supply Shock

What are the economic impacts and how will this affect the price of gold?
If you're interested in gold whatsoever, make sure you keep reading because I'm going to share some secrets with you that are going to blow your mind. Trust me.
Let’s begin by understanding the supply shock.
What is a supply shock exactly?
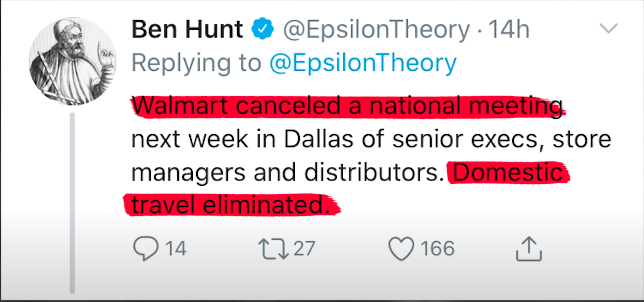
It's very easy. You go down to Walmart, nothing is on the shelves, you may say, “Well, George, I think you might be exaggerating a little bit.” Really? take a look at the following report.
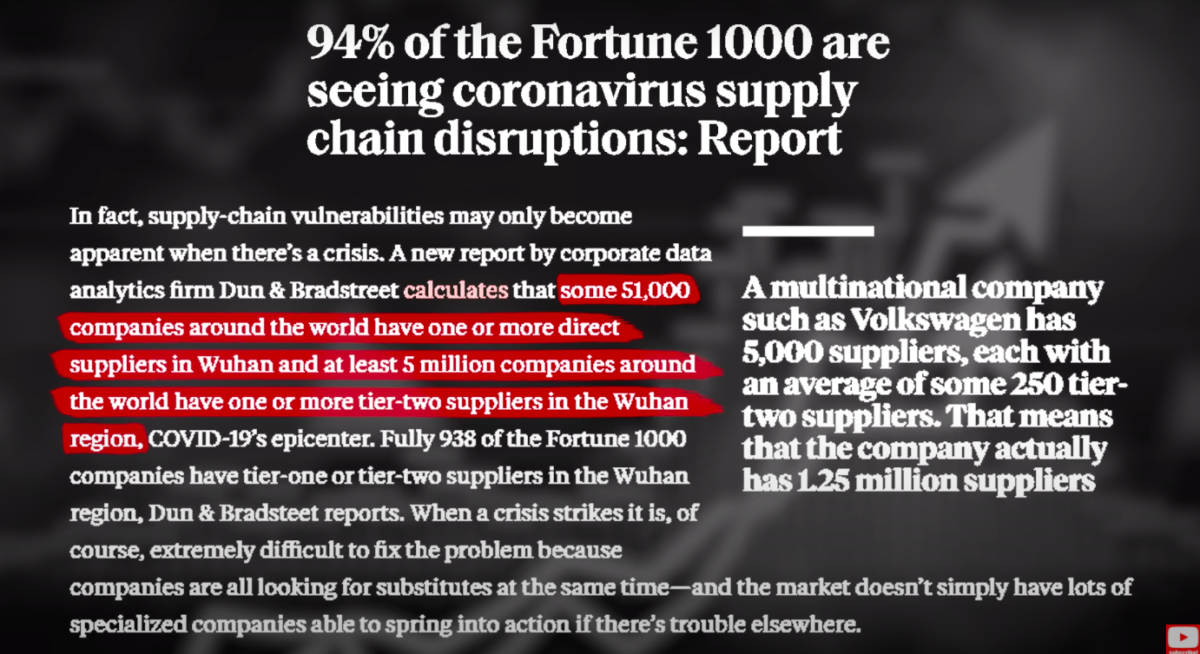
94% of the Fortune 1000 companies have part of their supply chain in Wuhan. Not just China, specifically in Wuhan. Globally 5 million companies have part of their supply chain in Wuhan, China.
What type of companies are these?
To grasp the magnitude of this problem, look at this infographic by Visual Capitalist where you will see the top 10 companies that import the majority of their goods from China. I think you're going to recognize some of them.
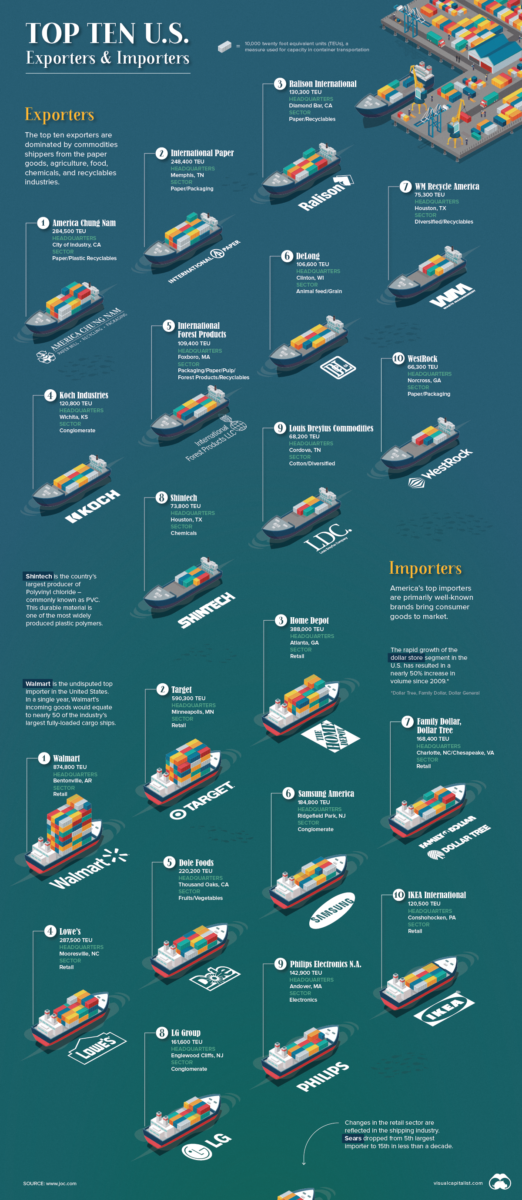
Walmart, Target Home Depot, Lowe's, Dole Foods, Samsung, LG, Philips, and IKEA. It’s not just stapled goods that you buy on a daily basis.
The majority of pharmaceutical ingredients are sourced in China.

In-car parts, as an example, Hyundai, one of the largest manufacturers of automobiles worldwide had to shut down many of their factories because they can't get those parts. They're not being made anymore in China.
This takes us to the Chinese PMI.
What is the PMI?
This is how Investopedia defines it.
“The Purchasing Managers' Index (PMI) is an index of the prevailing direction of economic trends in the manufacturing and service sectors.
It consists of a diffusion index that summarizes whether market conditions, as viewed by purchasing managers, are expanding, staying the same, or contracting.
The purpose of the PMI is to provide information about current and future business conditions to company decision-makers, analysts, and investors.
The PMI is based on a monthly survey of supply chain managers across 19 industries, covering both upstream and downstream activity.”
-Investopedia
Basically, the PMI is how well the manufacturing sector is doing in a particular country.
For example, look at this chart on China's PMI that goes from 2012 to 2020 and is measured from 40 up to 54.
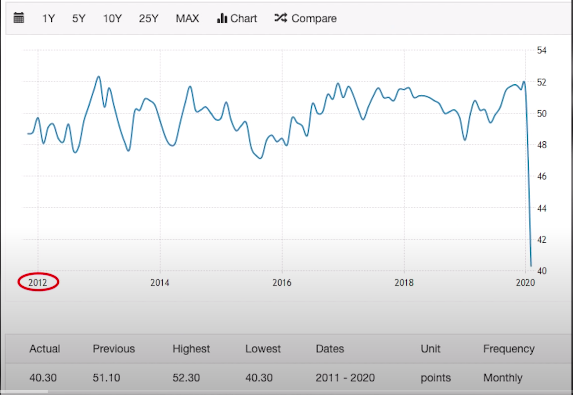
I'll break it down a little bit. It started in 2012, and it went up and down a little bit, pretty darn smooth until it got to a peak in 2020. In New Year's Eve, it got up to 53.
Everyone was celebrating! Those times were good. Manufacturing in China was doing fantastic. Then, what happened? It dropped off a cliff.
It literally went vertical all the way down to 40 on the PMI.
Keep in mind, that's a 12 point drop. That is huge. It went all the way down to a specific point that I am now calling SDT.
Can any of you guess what that stands for? I think you can. Stiff drink time.
You may be saying to yourself, “Yeah, George, I see this chart, but something has to be wrong. There's no way that it can drop that much even because of the coronavirus.”
But what we can do is, something I have Dr. Martenson to thank for, and is to cross-reference that with satellite images of pollution for Wuhan specifically.
This will tell us how much economic activity was actually going on during March.

Start by looking at 2019 images from January 1st to the 20th, January 28th to February 9th, and then February 10th to the 25th.
We have to look at all those dates because of the Chinese New Year. Then when you compare that to 2020, there's absolutely no pollution whatsoever. This tells us that economic activity backs up our PMI chart that drops off a cliff.
I want to point out one more thing that's extremely important and unique about a supply shock.
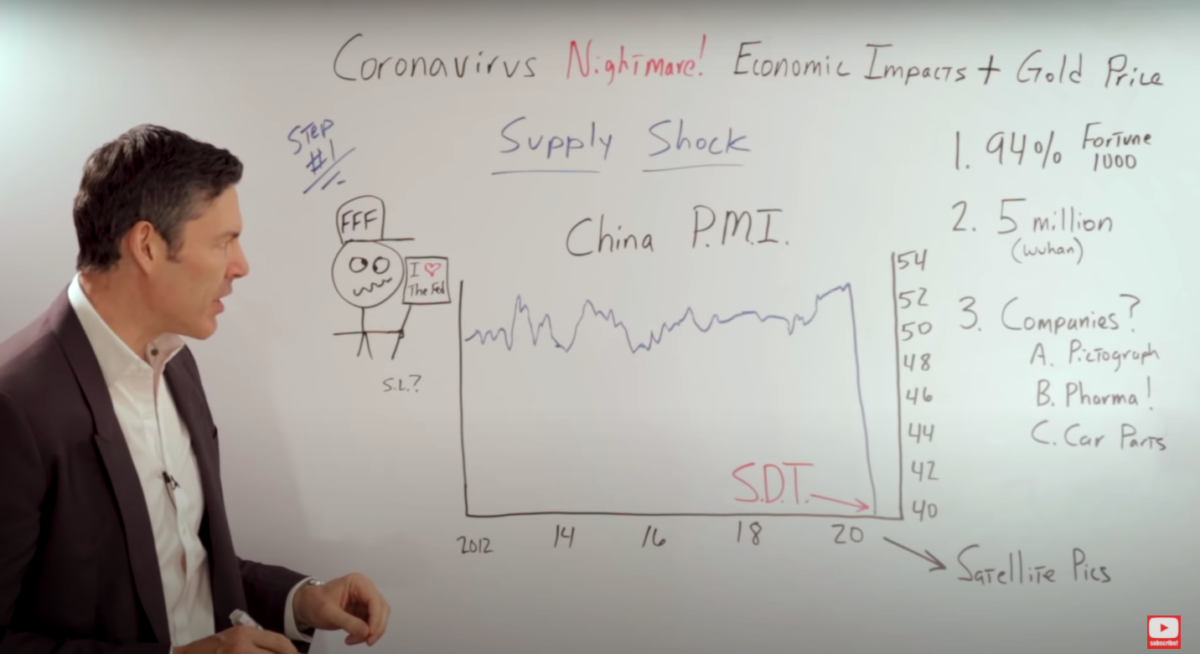
I'm sure right about now, your friend and family member, Fred, the guy who's holding a sign that says “I heart the Fed,” is coming in saying, “Yeah, don't worry about this. The Fed can drop interest rates. They can do quantitative easing no problem.”
What your friend and family member Fred doesn't realize is that the only tools at the Fed's disposal are meant to combat a demand shock, not a supply shock.
Think about it, if we have a situation like Hurricane Katrina where there are no goods stocked on the shelves.
Or a supply shock like the oil embargo we had in the early 1970s, if we get this, money printing or dropping interest rates will do nothing to help that.
In fact, it might exacerbate the problem through potentially higher inflation if they can get those extra currency units into the real economy.
Demand Shock: Consumers Not Spending Money

In the United States, consumer spending is 70% of GDP.
If consumer spending goes down, that is a big problem. Consumer spending is directly tied to consumer confidence.
Look at this chart of consumer confidence so you can see for yourself.
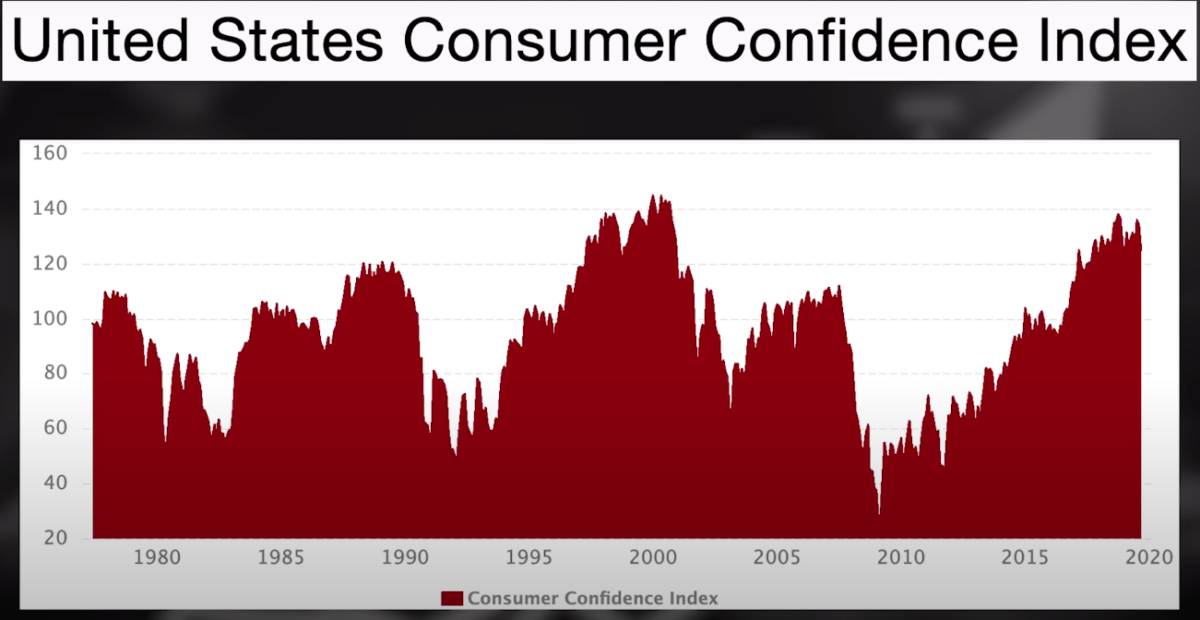
It starts in 1977 going to 2017 and it's on a scale of zero to 140.
In 1977, it was decent, but then it crashed down because of the recession in '81. In the 1980s it went up but later went back down because of the war and the recession during the 1990s until '92.
Then in 2001, after it went up again and stocks and consumer confidence were at an all-time high, we had the internet boom and the dot com bubble, and it all came crashing down, we had another recession.
It went back up again because of housing and they offload that bust from the dot com bubble to the housing bubble, but that eventually popped crashing down again.
The GFC market collapsed, and then came a big recession.
In 2013 once again it went all the way back up to 130 of course, that is a direct result of all the funny money the Fed has been printing. Stocks at an all-time high, unemployment at an all-time low.
Then COVID-19 arrived. By then stocks were around 30,000 on the Dow, but as we know, they have absolutely crashed.
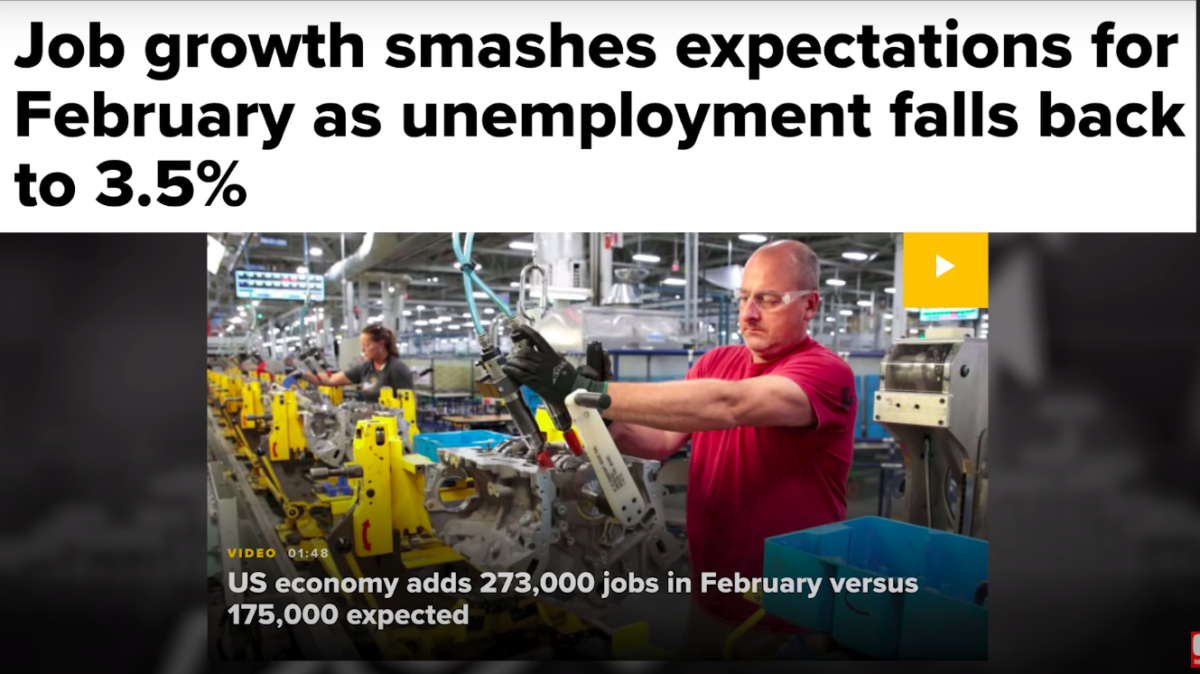
The last time I checked they were just a little over 25,000. That is a really big loss, but it doesn't necessarily mean that we're in a recession right now. The key linchpin to that is the unemployment rate.
Recently we have had a very good job number, but remember, those job numbers are a lagging indicator.
They tell us what happened a month or two ago. It doesn't tell us what's happening right now.
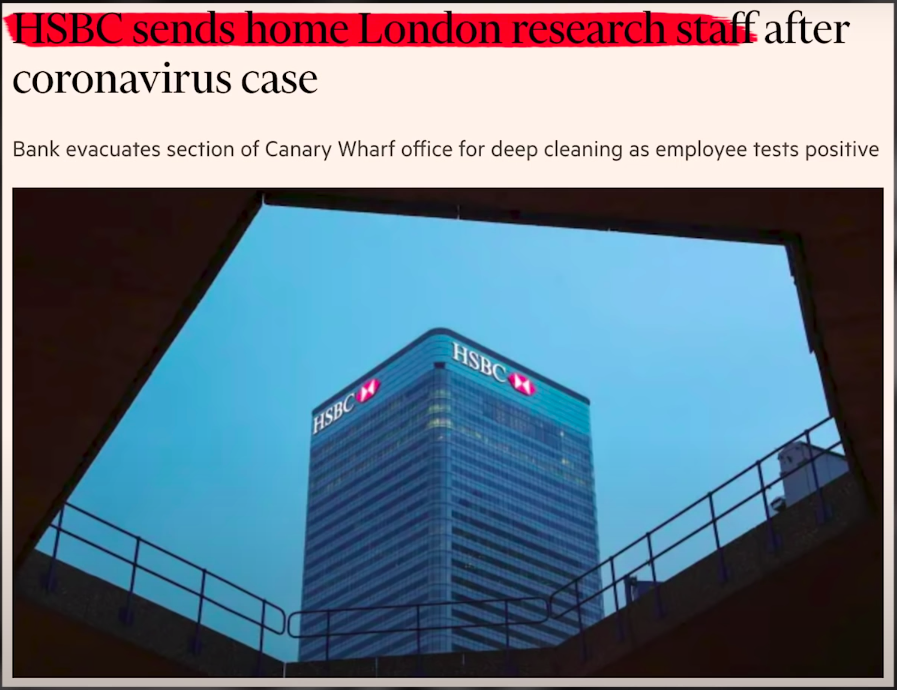
If we look at the news, companies are sending their employees home. Here are some examples of big companies like Wells Fargo, and your favorite, HSBC. This is really what we have to focus on.
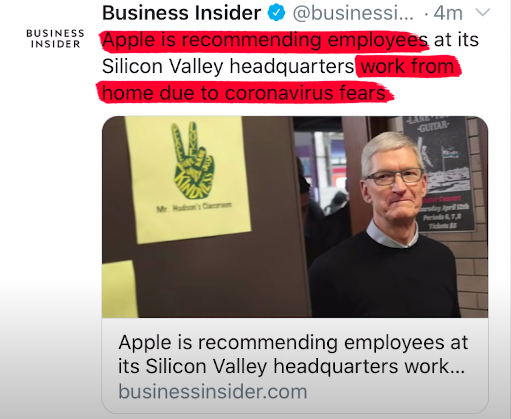
If the unemployment rate turns in the other direction and jobless claims increase, that could put us into a demand shock that we really, really need to be worried about.
I'm not the only one saying this, take a look at what Jeff Gundlach has to say about it.
Jeffrey Gundlach: If this situation with travel, Leisure, and non-social activity continues, you just wonder if you can keep initial claims down near 200,000 per week.
The five-year moving average of initial claims is around 243,000 and one of the most predictive aspects of economic statistics for recession is when you get unemployment claims on a weekly basis.
I use the four-week moving average because they're so volatile, but if they go above their five-year moving average, you're done. You can just put a fork in the economy.
(End of transcript)
Put a fork in the economy, that pretty much sums it up right there.
What is the end game?
If we have a supply shock and a demand shock, that's something we have almost never seen in history, especially not in the United States. I think the net result of that would be consumer prices taking Buzz Lightyear to infinity and beyond and high ticket items, including asset prices, completely collapsing.
Price Of Gold After Covid-19
What will the coronavirus nightmare do to the price of gold?
I know a lot of you, during the month of March, may have been scratching your head because gold fell off a cliff as you can see in the following chart.
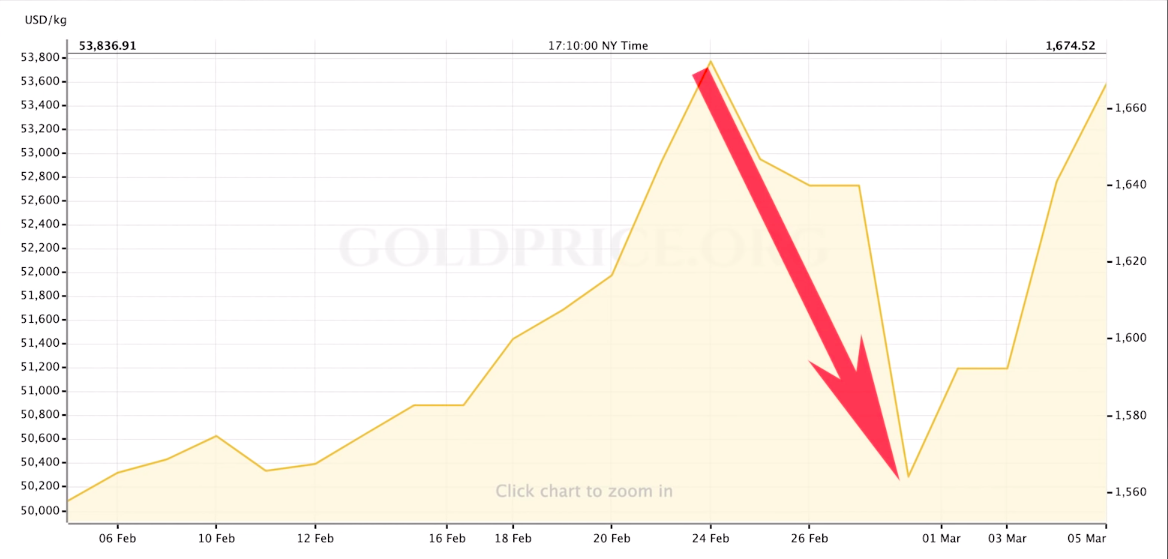
It's back up now, but why on earth did we see that huge price drop at a time with monumental fear in the market? It just doesn't make sense.
Wait one moment. Let me put the pieces of the puzzle together for you. Here is a chart of the repo fails and the price of gold.
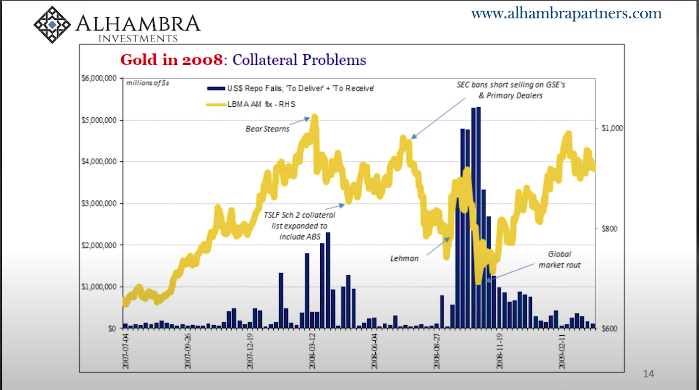
It starts in July of '07 and goes up to February of 2009. The blue bars indicate the amount of repos in dollars that actually failed.
Meaning that there's an agreement to do a $50 billion repo, and before they get to this specific time where the transaction needs to take place, one of the parties backs out.
I'll bet you didn't even know they could do that, did you?
The chart is the entire repo market and it goes from 1 trillion to 6 trillion. Remember, what we see on the New York Fed's website is only a small fraction of the entire market.
I'll break it down, the repo market started stable, business as usual, until it got to march 2008 with the Bear Stearns blow up.
All of a sudden, the repo market started to realize that those mortgage-backed securities might not be so safe. That created a collateral panic in the repo market.
That's why the fails start to spike but notice what the price of gold did. In 2007, fear gained more and more momentum. The price of gold also went up until Bear Stearns, then it came crashing down.
Why was it crashing down?
Maybe it's because there's a lack of collateral in the system. There's a panic in all those entities going into the repo market, having to sell their gold because they need that liquidity, and they don't have any collateral to get that cash like they normally would have.
Then the federal government came to change the rules and expanded the amount of asset-backed securities that the entities could use in the repo transactions.That solved the collateral problem.
In June fear kicked back in and the price of gold went up until the government came back into play and banned short selling on the GSEs.
Fear completely disappeared because the market thought the problem had been solved.
Gold sold off until Lehman brothers in august. From there, fear came back in a big big way. Gold went through the roof, to a thousand bucks a share but then came crashing down.
Because of Lehman, we had massive collateral issues. Look at what happened to the repo fails after August, they went up over $6 trillion dollars per night. Those were just the fails.
The market had a huge collateral panic.
Everyone sold every ounce of gold they had. Gold came all the way down to near 600 until the Fed stepped in with quantitative easing and started to print money.
This put a bandaid on the collateral issue, but fear set right back into the gold market, especially because they saw the expansion of the Fed's balance sheet.
This took the price of gold around 700, up almost 50% to a thousand. I know this may be shocking to a lot of you and you may be asking yourself, “George, what are you talking about?”
-
You mean to tell me that the repo market actually has something to do with the price of gold and that's across current?
-
If there are all these repo fails, that has the tendency to push down the price of gold in a crisis?
That is just crazy talk. Where are you getting this chart?”
I got this chart from a good friend of the channel and repo expert. You might know him. His name is Jeff Snider.
I'm guessing the question on everyone's mind right now is, “George, what are the repo fails and what are they doing right now when we're in the middle of the coronavirus nightmare?”
Look at the following numbers on the federal reserve bank to understand.
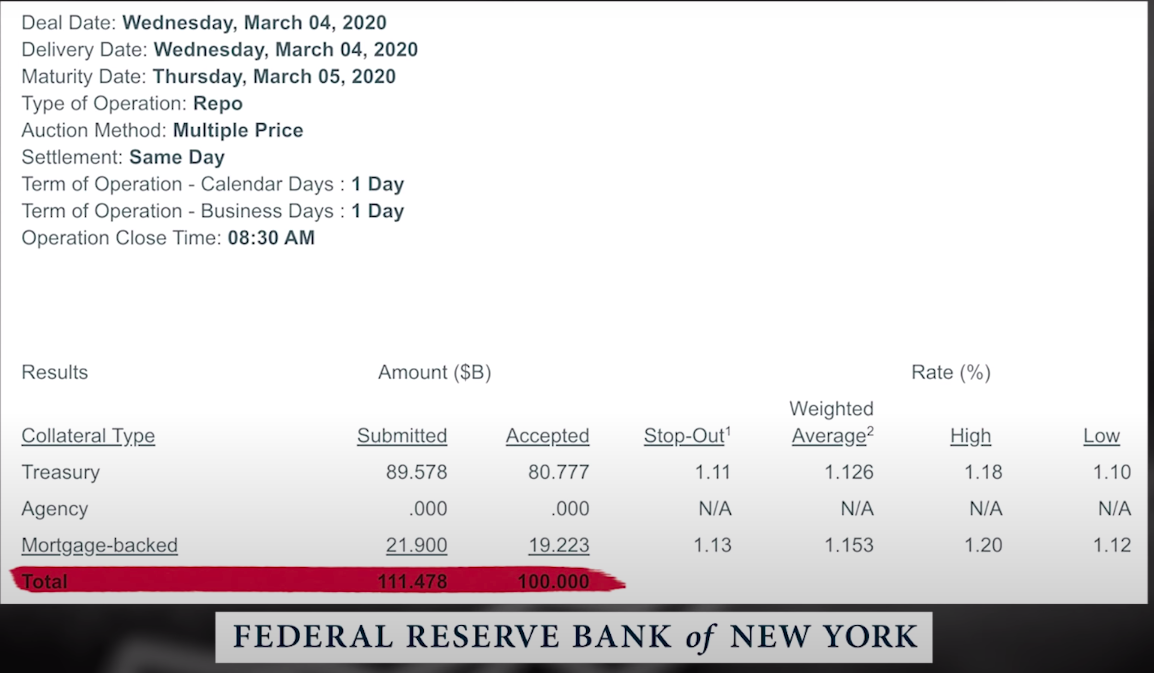
They're directly correlated to the oversubscribed repos that you can see on the New York Fed's website.
If you've been following my channel at all, you know as of the last days, the oversubscribed on the term repos have gone through the roof.
This gives us a specific answer as to why there could be a lot of downward pressure on not only gold, but silver, minors, and Bitcoin.
This is great news for all of us who are bullish on those asset classes.
Why? Because the Fed is going to “solve this problem” like they try to solve every problem, and that's with more and more money printing.
If they do achieve their objective of getting the fails and the oversubscribed repos down to a manageable level, that means the collateral issue goes away and we get right back to where we were in September of '08.
Where now all that's left is fear and money printing sending the price of those assets to infinity and beyond.
The main takeaway is the solution the Fed has. The only solution is the exact thing that will make all the asset classes go parabolic.
Let's take it right back to gold. If we assume that gold is going up, if we are bullish in the future…
-
What's the best way to play it?
-
What is the best strategy that allows us to maximize our returns?
To dive into that a little deeper, here is a transcript of an interview I had with Marin Katusa.
George: Correct me if I'm wrong, the price of gold itself and the price of the GDX went up about 30, 40%, but some way, you invested in gold, it went up by like 90%.
First and foremost, am I saying that correctly?
If I am, can you kind of maybe walk us through the structure of how you created a return that was so much more substantial than gold itself?
Marin Katusa: There are a few reasons why, not because I'm smarter, that's a debate for another day, but it comes down to this. I'm the largest investor in my fund.
Rather than owning 40 stocks, I really honed in and focused.
Since MacroVoice was up another 50% since then, it's like well north of 140%, my whole focus is being first to the story, structuring these products where you also get a warrant kicker.
So when you do financing, if it works out, you get paid twice.
One thing I want to share is I was the first guy to write up the potential of Newmarket because they were buying Fosterville. That became Kirkland Lake. I did that at a dollar and change that ran up to $60.
My mistake there was I sold too early. I did a whole analysis about how to sell and my mistakes and now, what I've actually told people is,” look, you're sitting at like a 400% gain on the stock.
You should probably reduce, and it's called the Katusa free ride, but I'm holding on because I believe there's nothing better than this deposit in the US, and until I'm proven wrong or it gets taken out, I'm going to run with this.”
So, there's the aspect of knowing what to buy, but then I get in and explain to people my psychology about, “Holy crap, we're sitting at a 480% gain on this. Should I sell some?”
It's a struggle, it's an emotional going, “Maybe I should reduce my risk.” There are other times that the stocks don't work out that I've had big runs.
It's a process. Just because I've done very well over the last eight years, doesn't mean the next day will be great, but every day is a battle. It's a tough market.
For me, it's an honor to be compared to guys like Rick.
(End of transcript)
George: For more content that'll help you build wealth and thrive in a world of out of control central banks and big governments, make sure you check out my full-length interview with Marin Katusa.