Introduction
The Federal Reserve continues to hike interest rates. As a result, I think they just delivered a death blow to the economy. I'm gonna explain this to you in one simple fast step. Let's start by going over Jerome Powell's huge mistake.
Jerome Powell's Huge Mistake
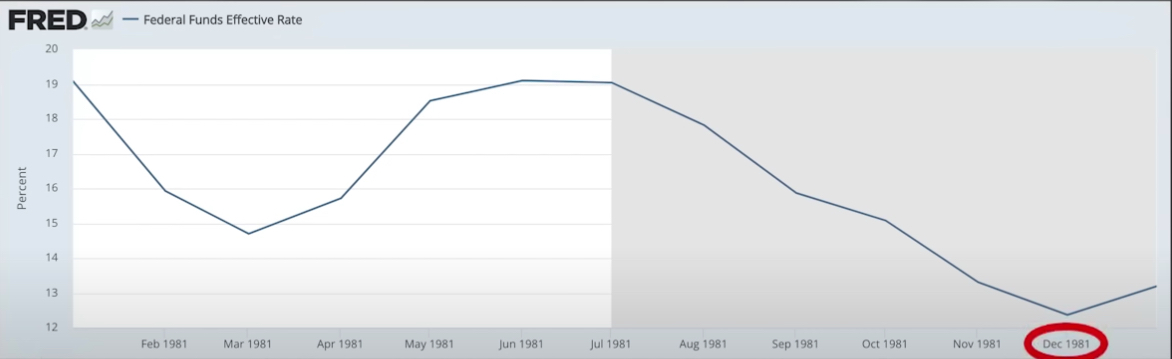
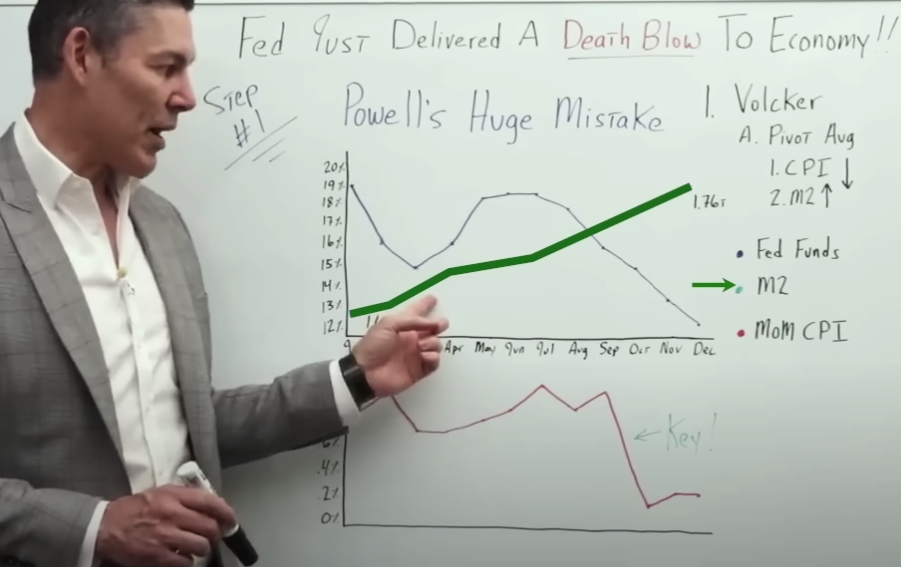
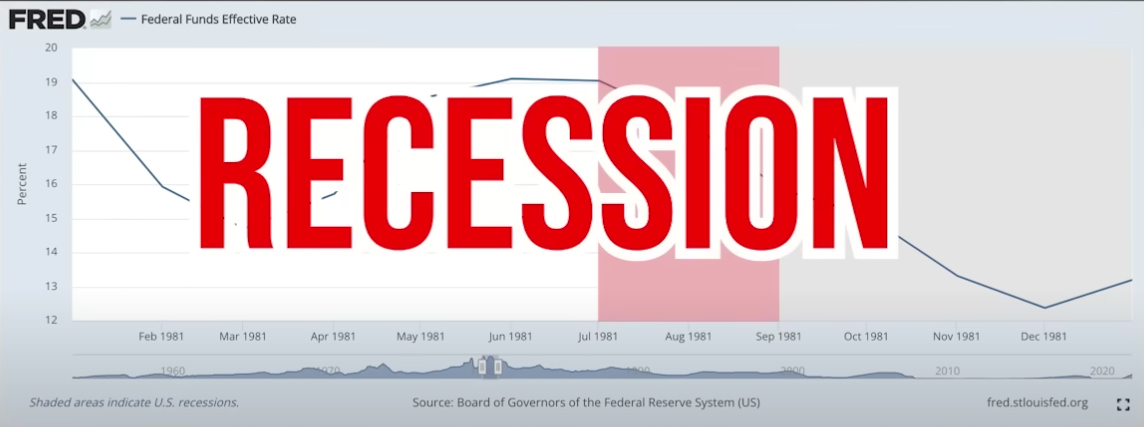
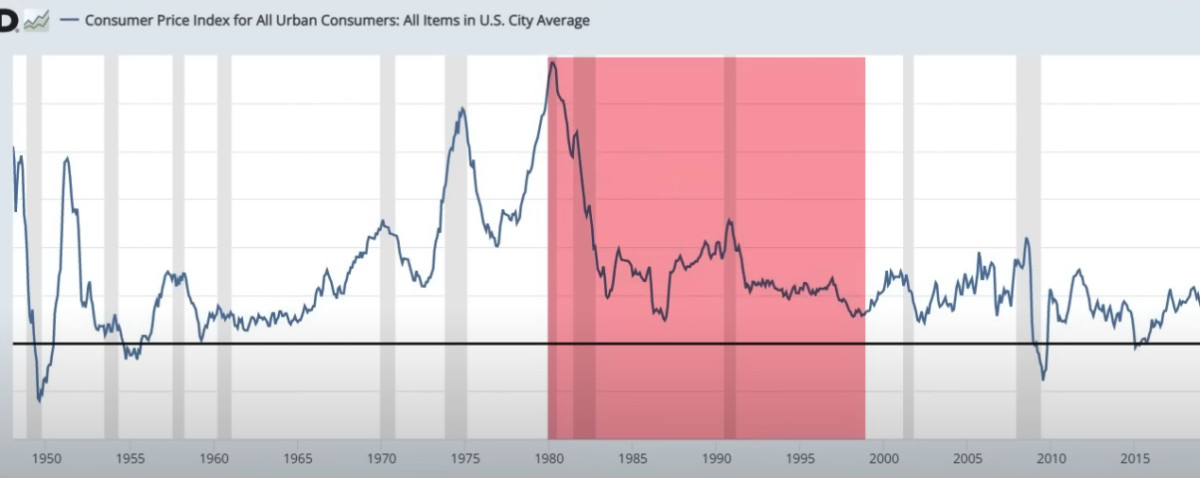
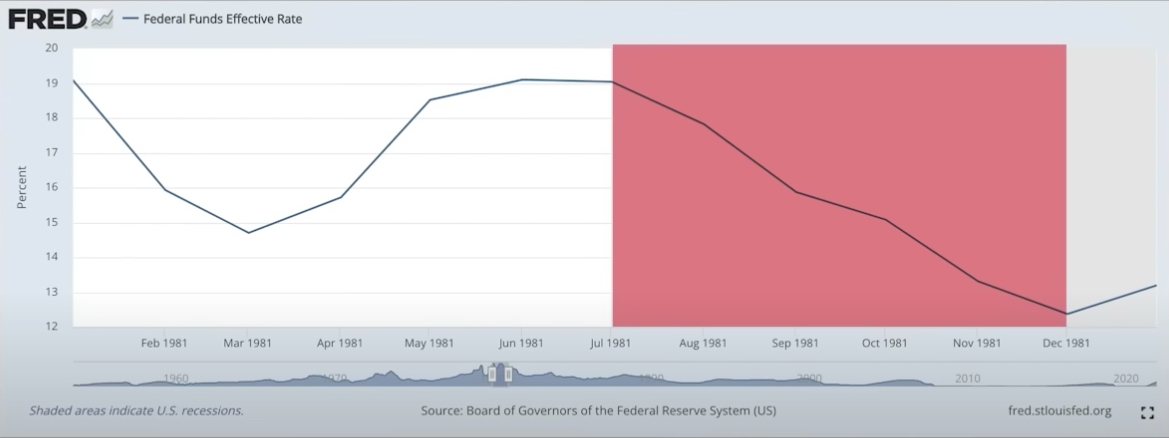
Below is a 1981 annual chart of the Federal Funds Effective Rate, going from January to December.
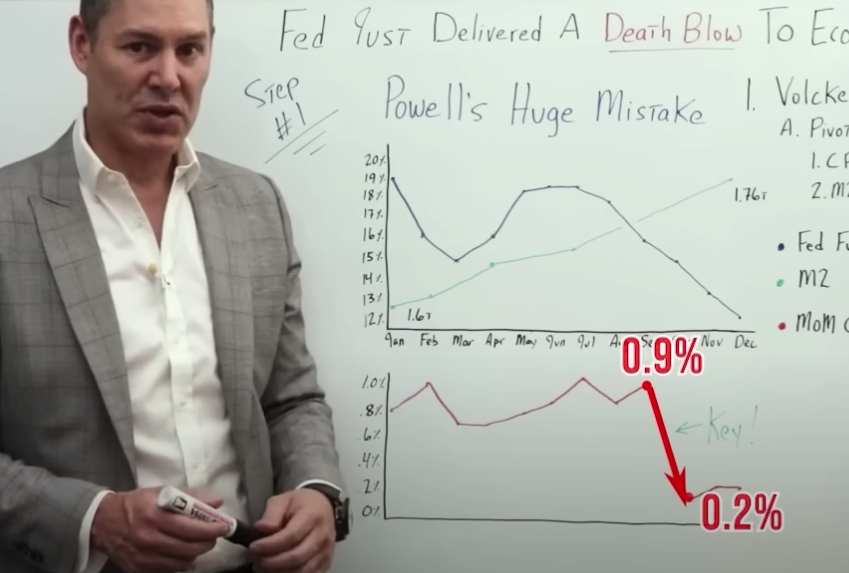
The charts I've drawn below include the 1981 Fed funds and M2 money supply (top chart) and CPI (bottom chart in red) for the exact same time frame.

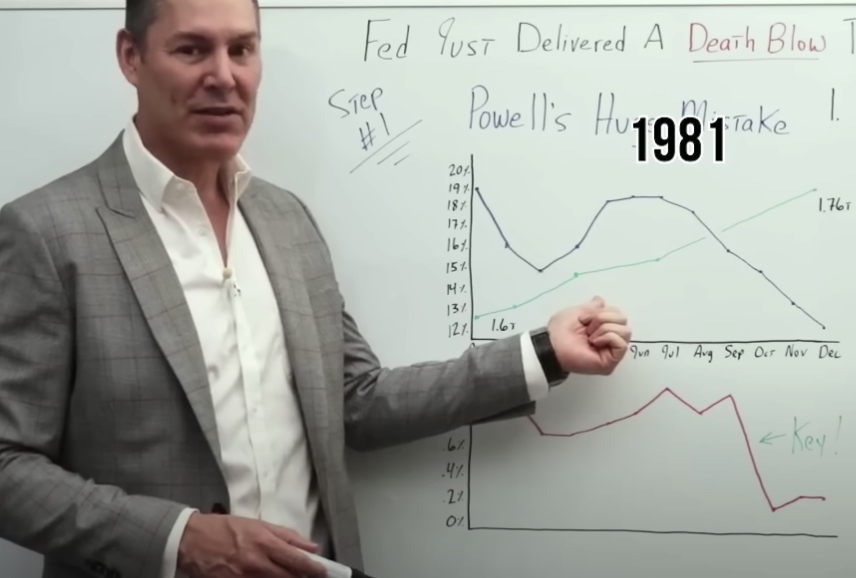
First, we're going to focus on the Fed funds rate. On the left, we go from 12% interest up to 20% interest.
Back in January of 1981, the Fed Funds Rate was at 19%. It then dips and hits a local bottom in March before moving back up to 19% in June. Then around late July-August-September, rates start to drift down again. In December, the Fed pivots. We're waiting for Jerome Powell to make a similar pivot in 2023.
Now, just to be very clear, when you go into 1982, interest rates did go back up slightly (not shown), but they never went back up to where they were at the high point like in July of 1981.
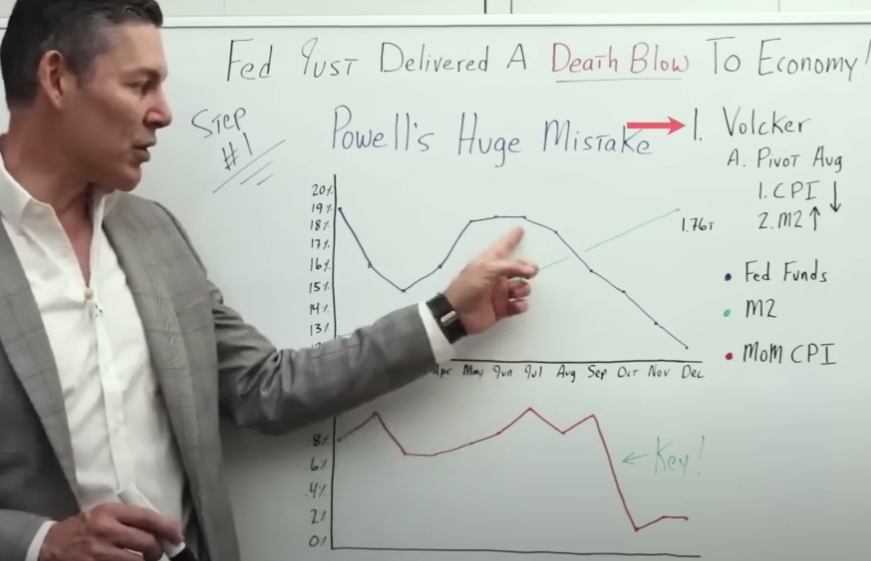
Again, the summer of 1981 is when we can officially say that Paul Volcker pivoted.
Now let's go ahead and move on to this green line, I think you're going to find this fascinating.
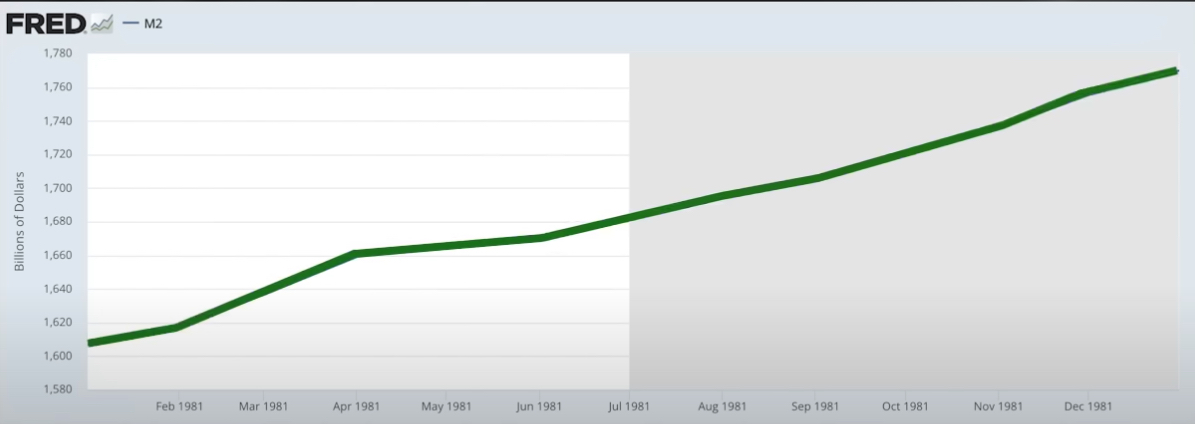
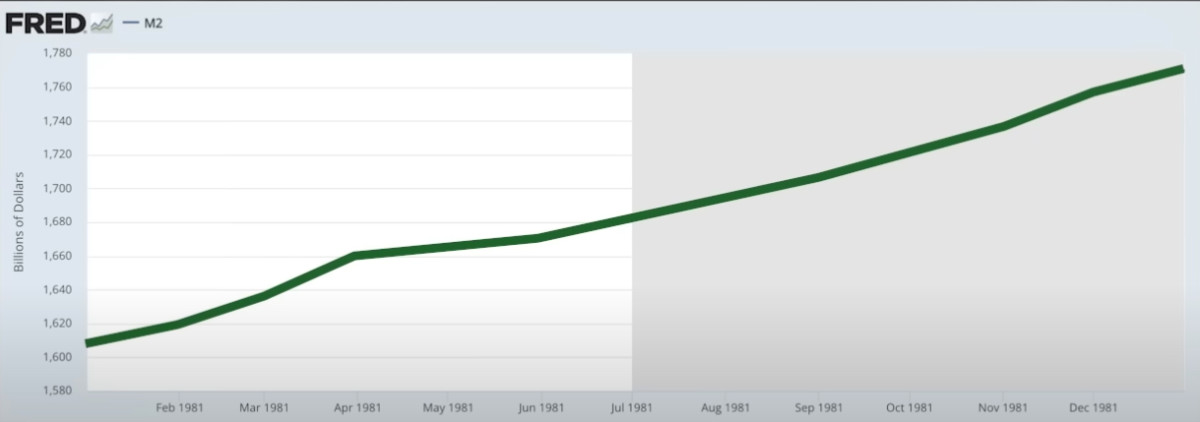
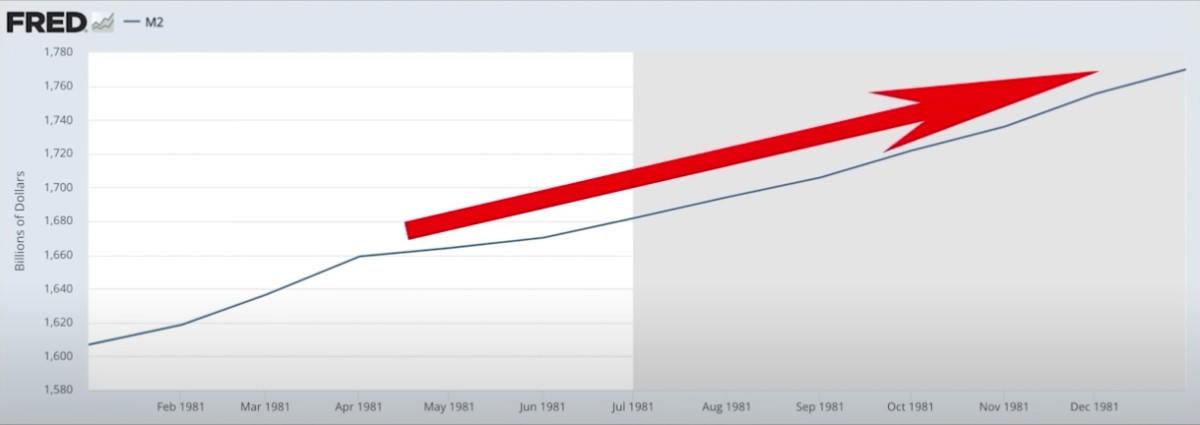
The green line represents M2 money supply during the exact same period. In January of 1981, M2 money supply was right around $1.6 trillion.
You would expect that if Paul Volcker “broke the back of inflation”, in the summer of 1981, this would have been a result of the money supply going down, or at least flattening out. We can see, that this was not the case.
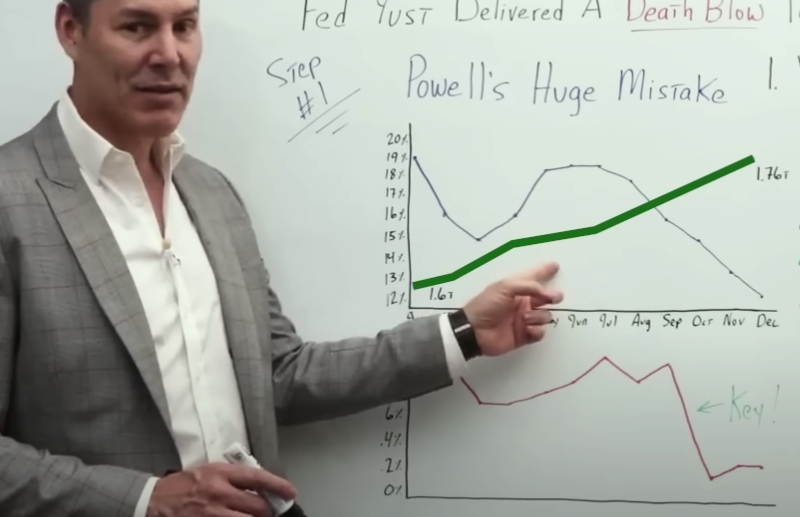
In fact, M2 money supply during the span of 1981, went from $1.6 billion, up to roughly $1.76 billion. So an increase of $160 billion. Which at the time was a very high percentage, a significant percentage of the overall M2 money supply.
As Paul Volcker was pivoting, for good, M2 money supply was still going up a substantial amount.
Now, you may be asking yourself, “Okay, George, well, why does that really matter? I'm not an economist.” That's a very good question. We're gonna get into that in just a moment. But before we do, let's look at month-over-month CPI.
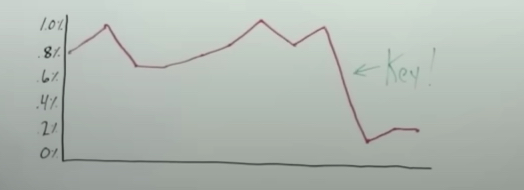
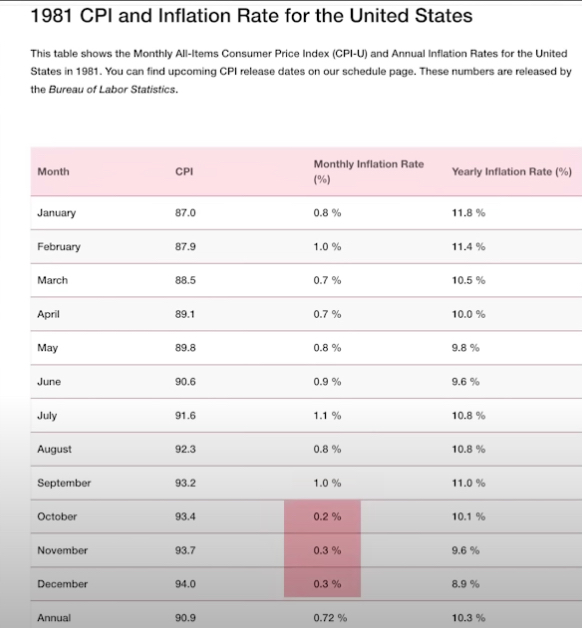
This is the same time period in 1981, but it represents month-over-month CPI.
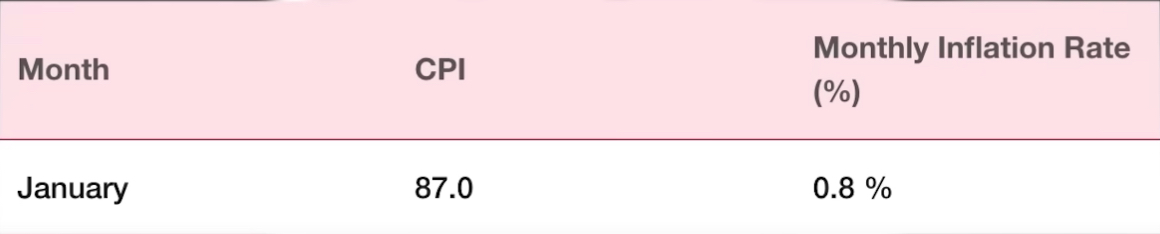
In January 1981, the CPI was about 0.8%.
What I want to point out, is right around August-September, when Paul Volcker pivoted for good, there was a massive drop in month-over-month CPI, from roughly 0.9%, all the way down to 0.2%. Then there were some fluctuations going into 1982. But it stayed at this lower baseline.
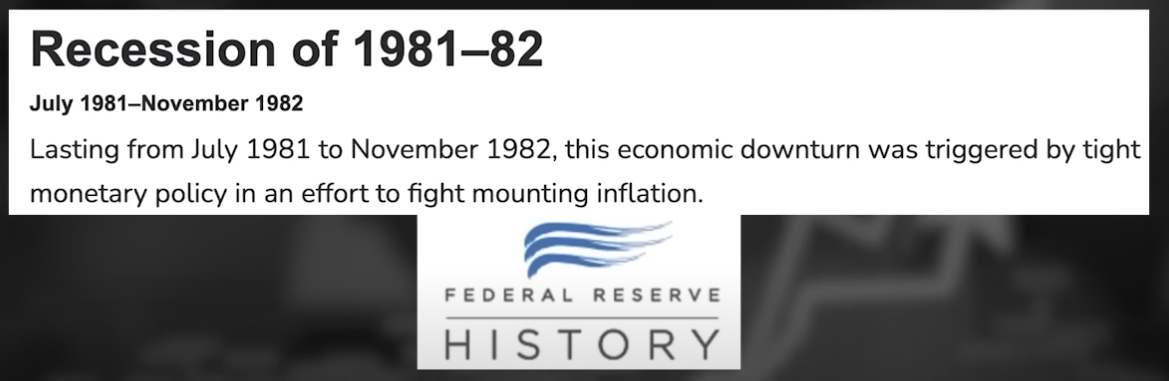
Before we move on to more recent data in 2022 and 2023, that shows this huge mistake that Jerome Powell is making, which I think will lead to a death blow for the US economy, I want to emphasize that as a result of Paul Volcker's actions in 1981, the US went into a massive recession.
Just to review, Paul Volcker jacked rates while M2 money supply was still going up, and he pivoted roughly around the same time CPI plummeted.
Let's remember, there's a lag effect with the Federal Reserve raising interest rates, meaning if the Fed raises interest rates, the economy most likely feels the impact of those interest rate hikes six or nine months into the future.
If Jerome Powell is raising rates right now, taking them up to 4.5% or higher into the future, then those interest rate increases are going to work their way through the economy over the next six to nine months. Then we're going to see the true full impact. It doesn't happen in real-time.
If Paul Volcker had not pivoted around the summer of 1981, then the recession that he created, would have been much, much worse.
In my opinion, this is the catastrophic mistake that Jerome Powell is making right now. That is, he is delivering and will continue to deliver a death blow to the economy.
Powell's Interest Rate Hikes
Let's see what Powell is doing today, and what he did throughout 2022, then compare that to Paul Volcker in 1981 so we can start to draw some conclusions for 2023. We may see a severe economic downturn, and I'm putting that lightly.
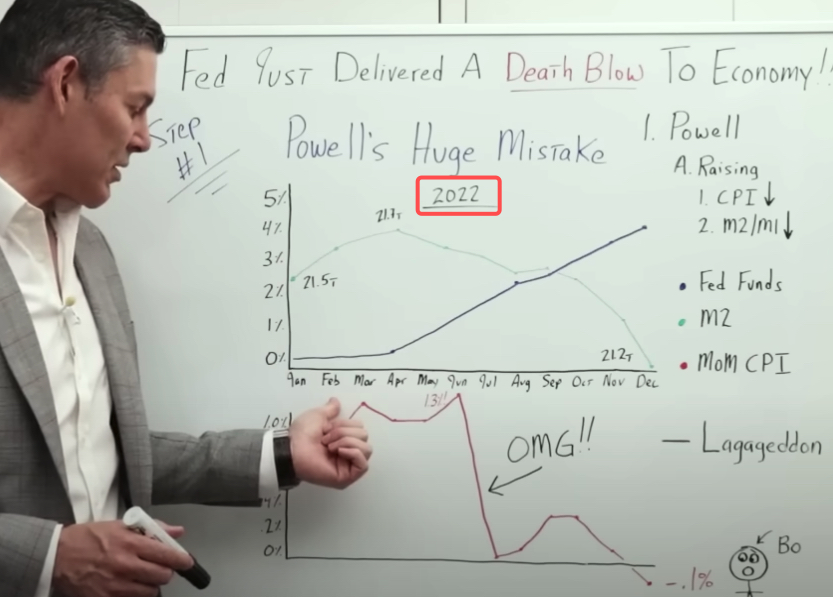
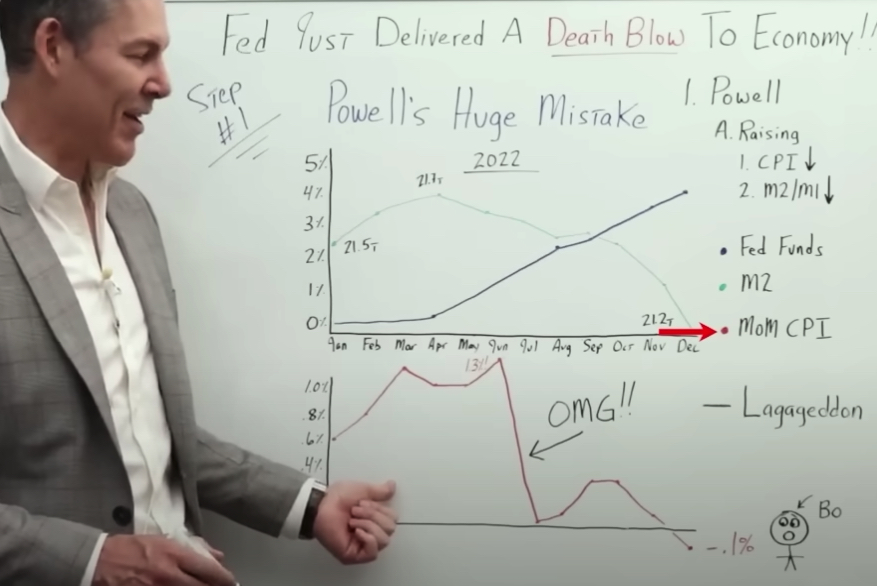
We're using the same charts, and the same data points as we did in 1981, but this time January through December 2022.
On the left, we go from 0%, up to 5%.
Fed Funds Interest Rate Hikes
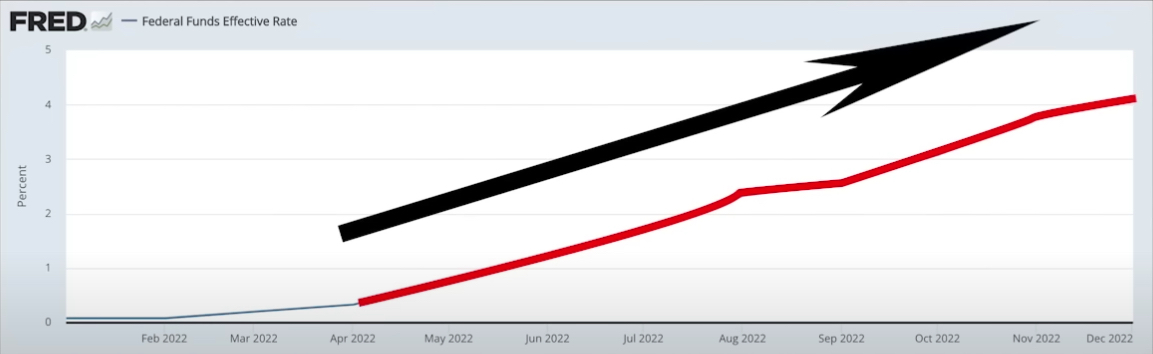
We'll start with Fed funds. And this is fresh in everyone's memory, I'm sure. In April 2022, Powell started to raise rates. He then continued to raise rates at the fastest pace we have ever seen.
From April to December of 2022, interest rates basically go from, let's say, 0-25 basis points, all the way up to 4.25%.
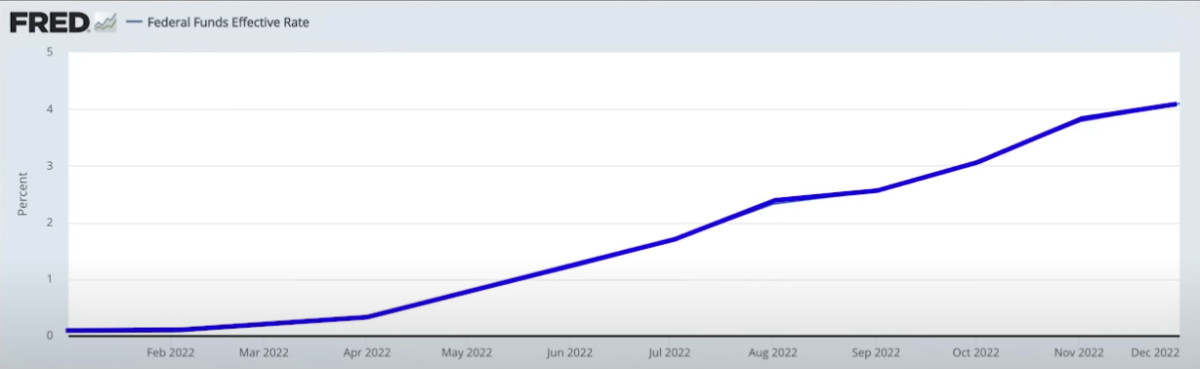
And I know a lot of you right about now are saying, “Well, George, it's still only 4.25%. And historically, I mean, that's on the low side of average.” And you've got a great point.
Speed Matters
What you have to realize is the rate of change is incredibly important.
My good buddy, Adam Taggart has a good analogy for this. He says, If you drink a gallon of water over the span of a week, well, that's actually good for you. But if you drink that gallon of water within the span of a minute, it'll basically kill you. And that's what we're dealing with right now.
I'd also like to point out that just taking interest rates, let's say from 25 basis points all the way up to 425 basis points, is roughly a 15x increase. That is absolutely unprecedented.
Now let's go ahead and look at M2 money supply, just like we did with the previous charts in 1981, with Paul Volcker.
M2 Money Supply Today
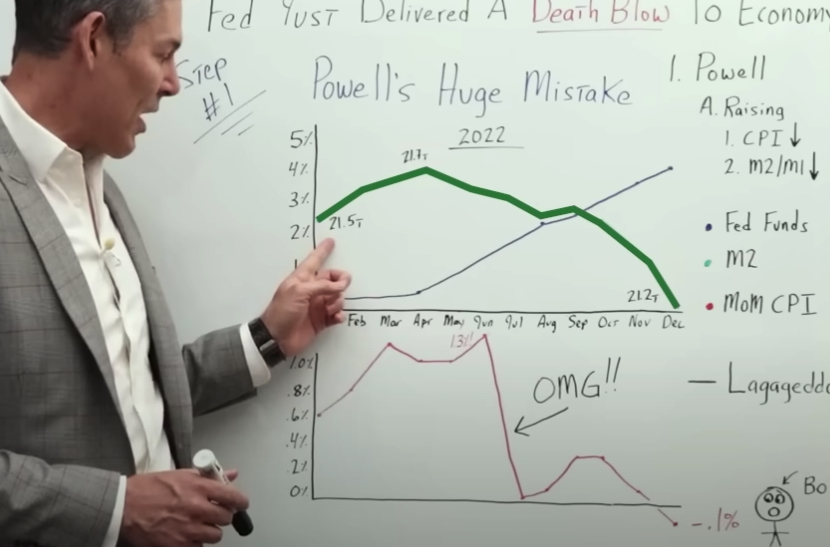
We start off with M2 money supply represented by the green line at $21.5 trillion. It goes up and peaks at a little over $21.7 trillion. But then notice what happens. Right about the time Jerome Powell starts increasing interest rates like a madman. M2 money supply actually goes down. It plummets from $21.7 trillion down to $21.2 trillion.
And if we look at the charts, we can see that M1 money supply is also declining.
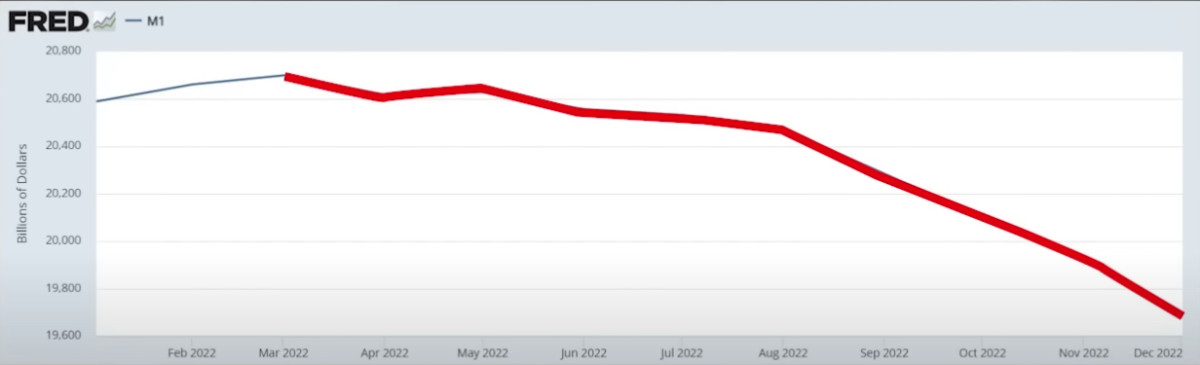
So as you guys know, just by using some good old-fashioned common sense, the number of currency units that are outstanding, chasing goods and services has a significant impact on Consumer Price Inflation. Let's go ahead and think this through.
During Paul Volcker's time, he pivoted around the middle of 1981 and the CPI came all the way down to a level that stayed very, very low into 1982.
Then as we all know, throughout the rest of the 1980s, and 1990s, we experienced decades of disinflation.
In 1981, while Paul Volcker was pivoting, M2 money supply was not going down. It was not flatlining. It was actually going up.
What is the impact going to be when Jerome Powell is raising rates at an unprecedented pace while M2 money supply is actually going down?
Unfortunately, we've only begun to scratch the surface. Let's go ahead and look at that chart of month-over-month CPI.
It goes from 0%, up to 1%. And keep in mind is the exact same timeframe as the chart above it, January to December 2022.
So the CPI in January was 0.6%. And then we go up to a peak at 1.3%. And again, this is just month-over-month. But then in June, it just absolutely plummets all the way down to 0%.
In the month of July, prices did not increase at all. Whereas in the month of June, they increased by 1.3%.
The next question becomes, what happened after we saw CPI Absolutely tank?
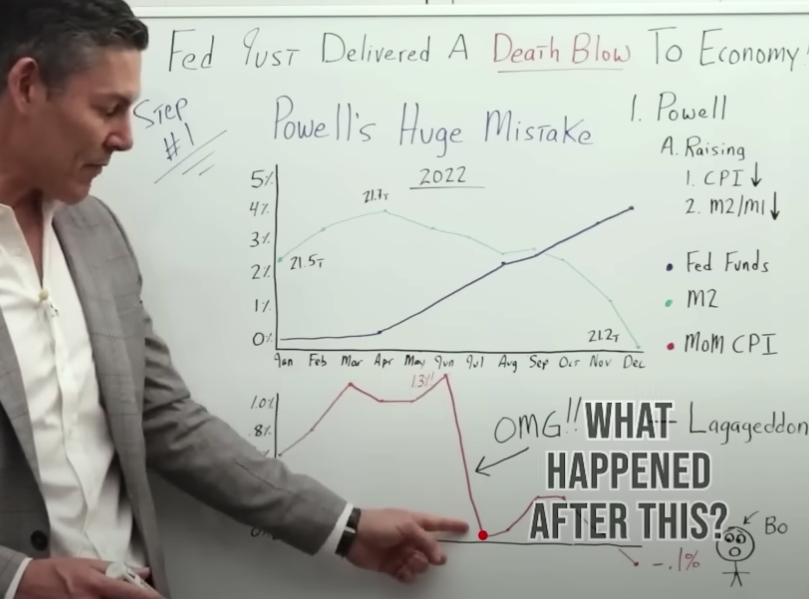
Well, CPI went up slightly, back to 0.4%, in the months of September-October. But then in November, it went down. And then in December, it went down to a negative… -0.1%.
How Interest Rate Increases Impact The Economy
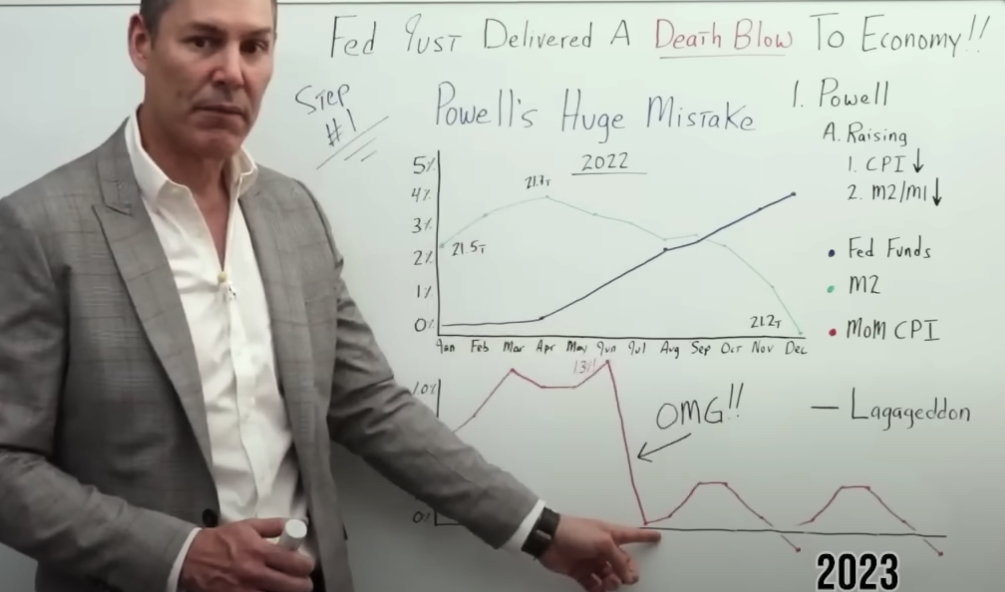
So my main point here is if we were to take the last six months of the month-over-month CPI readings and move them forward, assuming that the next six months going into 2023 will look similar, the CPI will have gone from, let's say, 9%, all the way down to roughly 2.5%.
And keep in mind, there's a huge lag effect to Jerome Powell's interest rate hikes. Let's go ahead and review quickly to make sure we're all on the same page.
In 1981, when the CPI crashed, right around that timeframe Paul Volcker pivoted.
And we also have to remember that M2 money supply was going up.
If anything, this gave a tailwind to the CPI, which I'd like to remind you stayed at a relatively low level going into 1982 and then throughout the 1980s.
So I think it's safe to assume that if Paul Volcker would have continued raising rates higher and higher, instead of pivoting when he did, the impact on the US economy would have been far greater. Instead of a severe economic recession, it may have been an economic depression.
Now, in 2022, what has Jerome Powell done in the face of:
- Declining money supply, which should put downward pressure on CPI,
- Considering that CPI has gone from 1.3%, all the way down to 0%, and in December, it's at -1.0%?
Well, despite all of this economic data, he continues to raise rates higher and higher and higher.
If Jerome Powell had been Paul Volcker, he would have pivoted way back in June of 2022. I'd like to remind you that we have yet to see the full impact of these interest rate hikes.
[ctt template=”3″ link=”M2HK3″ via=”no” ]If Jerome Powell were Paul Volcker, he would have pivoted way back in June of 2022. We have yet to see the full impact of Powell's interest rate hikes.[/ctt]
Interest Rate Hikes: What to Expect
Unfortunately, I think throughout the rest of 2023 and into 2024, we are going to see economic devastation created by these excessive rate hikes.
[ctt template=”3″ link=”P1Y_b” via=”no” ]Unfortunately, I think throughout the rest of 2023 and into 2024, we are going to see economic devastation created by Powell's excessive rate hikes.[/ctt]
Comments are closed.