Introduction
The Federal Reserve and the mainstream media are lying to you, again. I'm gonna explain what they're lying about.
I'm gonna give you the reasons why I think they're lying. And then I'm going to tell you what I think motivates them to continually lie.
And I'm going to do that for you in three simple fast steps.

1. Is a Soft or Hard Landing Recession Inevitable?
Soft Landing
Everyone has been watching the news lately and realizes that the probability is very high, that we go into a recession in the near future. But is it going to be a soft landing or a hard landing? Let's explore that first.
[ctt template=”5″ link=”cd764″ via=”no” ]People who are paying attention are predicting a recession in the near future, so it's no surprise that many individuals are asking: will it be a soft landing or a hard one?[/ctt]
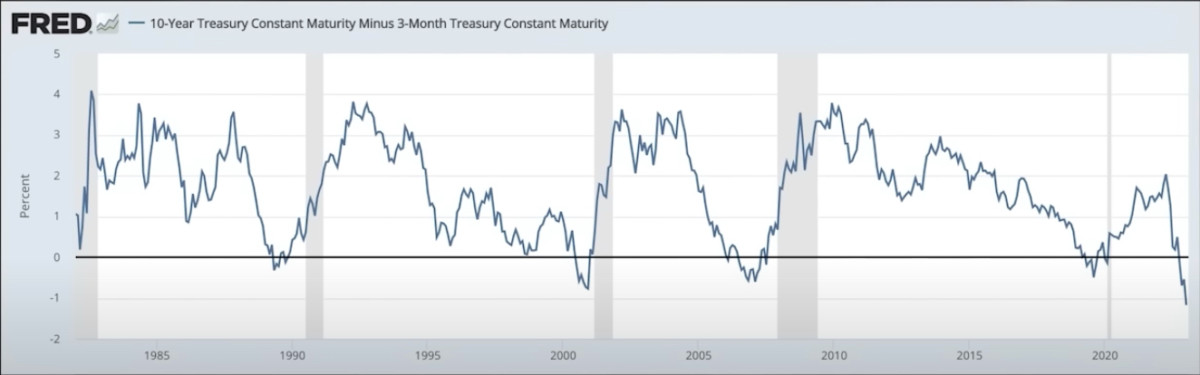
I've got a chart going all the way back from 2000 to today's date. This is the three-month Treasury yield versus the 10-year Treasury yield.
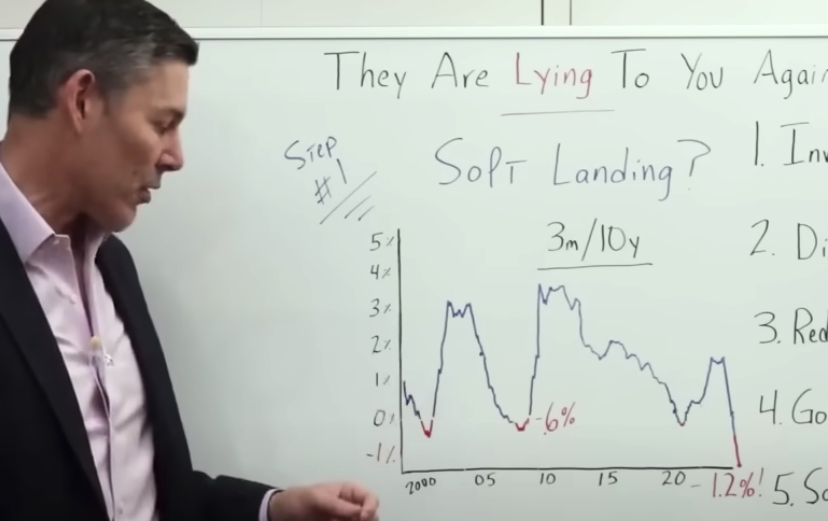
On the left, we go from -1% all the way up to 5%, because we're looking for inversions.
We start in 1998, at about 1%, then we see an inversion. We get the dot-com recession, and then the yield curve steepens significantly. Then it starts to go right back down. That gives us a warning for the Great Financial Crisis (GFC).
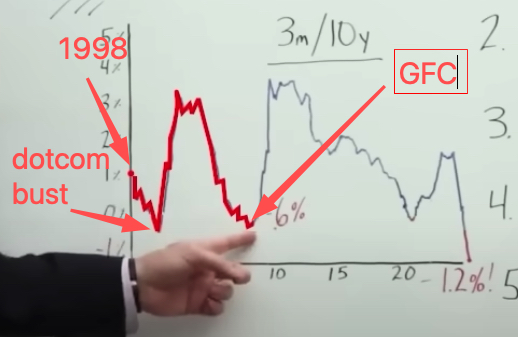
I want you to pay very close attention to how inverted this curve was just prior to the GFC. In fact, right around February 2007. More on that in just a moment. That's a very important date and you'll see why throughout the rest of this article.
During that time, inversion was about 0.6% or 60 basis points. Of course, it steepens again, and it inverts just prior to the pandemic.
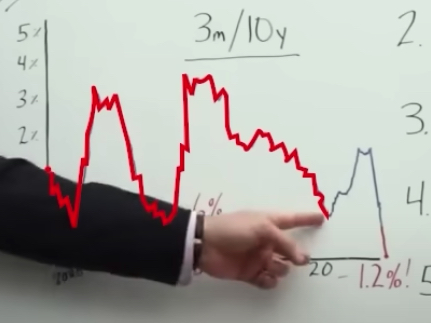
So the next question becomes, where are we now? And should we be concerned about it?
We look at today's date, and the inversion is not 0.6, but actually double that, -1.2%.
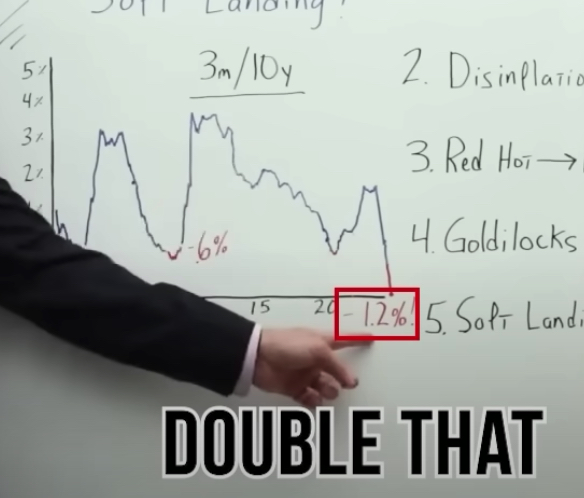
I know a lot of you right now are watching this and saying, “Okay, George, I get what you're saying. But I'm not an economic expert. If the yield curve is twice as inverted, does that mean the recession is going to be twice as bad?” Well, not exactly. But you're getting close.
[ctt template=”5″ link=”390XO” via=”no” ]If the yield curve is twice as inverted (it is) as it was leading up to the GFC, does this mean the recession is going to be twice as bad?[/ctt]
Let's go ahead and cut right to a clip from a recent discussion I had with my good buddy and Ph.D. economist, Bob Murphy.
George: Have you given any thought to the magnitude of the inversion? Because, you know, we are talking about how 60 basis points now, it's 1.2%. And you had a listener say, “Bob, you know, what does this mean that it's so inverted?” Have you given that any thought? And do you think that implies that there's a hard landing, compared to maybe a soft landing?
Bob Murphy: I mean, that's my intuition. I'm coming from the Austrian School of Economics, and so we don't like to just look at data. And you know, you want to have a solid theory. And so what I did is reconcile this pattern with Misesian standard business cycle theory.
And it does make sense because in a boom, the central banks flood money into commercial banks and they are following suit, and they're expanding credit artificially, and interest rates get pushed down.
But then to be more specific, and say, “well, which interest rates?” Well, it's the shorter-term ones that are more malleable and that bank policy has more effect on. That's a “normal upward-sloping yield curve”. Which we would consider in the midst of a boom, using the Austrian framework.
And then the bust happens, then they chicken out or whatever, and they slam on the brakes, and short rates rise above long rates.
So if that's generally correct, then yeah, my intuition would be, the more yield curve inversion there is, the more likely the prior boom was either really inflationary, or they're just slamming the brakes really hard, which leads you to think.
So it's actually probably better from a long-term perspective if you if you're an Austrian, or sound money person to think, no, they're just pulling the band-aid off fast, as opposed to you know, trying to trickle it out.
But in terms of like, How bad will the recession be right in the beginning, it's probably going to be worse than your typical recession.
So based on the Austrian view of economics, which is what Bob specializes in, if the yield curve is significantly more inverted, that would lead us to believe that we will not have a soft landing, but we will have a hard landing. Now, of course, there are no certainties there are only probabilities.
[ctt template=”5″ link=”b6f35″ via=”yes” ]Based on the Austrian view of economics perspective, if the yield curve is significantly inverted, then we will have a hard landing.[/ctt]
What this is telling us is that the Fed has raised way, way, way too much relative to the amount of outstanding debt.
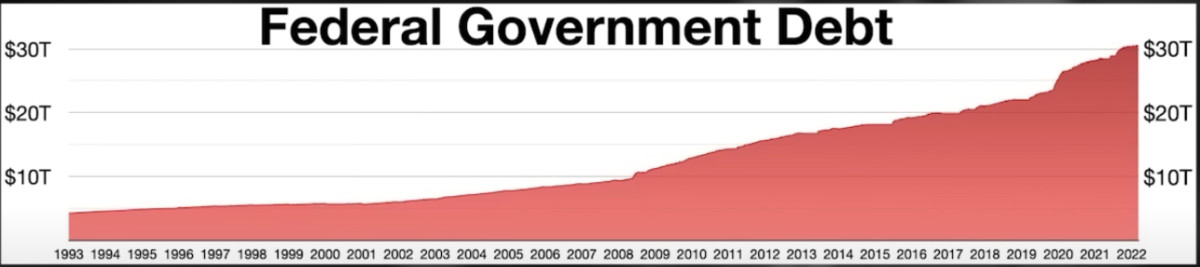
And when those debts are rolled over, the misallocation of resources has to be wiped out of the system, including malinvestment, which would lead you to believe that this time around, it could be worse than what we saw during the GFC.
And at the very least, the probability is a lot higher, that we have a hard landing, as opposed to a soft landing.
Hard Landing
So I'm sure right about now, your friend and family member Fred is going to be watching this video and say:
“Ah, George, you're just fear-mongering again. Man! You just hate authority. The Fed is awesome, and the mainstream media rules, but you just have a big chip on your shoulder.
How do you know that just because we have a hard landing or whatever your stupid chart says that the mainstream media and the Fed are actually lying? You have no proof whatsoever!
In fact, prior to the GFC, the mainstream media and the Fed were most likely predicting that we would have a hard landing because they are the experts. You are just some schmuck on YouTube.”
All right. Well, your friend and family member Fred has a fair point. And we'll push back a little on your friend and family member Fred.
Okay, let's go straight to the New York Times. Title of this article – Fed Chairman Projects Soft Landing For The US economy.
“The Chairman of the Federal Reserve Board has given Congress an upbeat view of the US economy predicting that unemployment was likely to remain low over the next two years, even as inflation declined slightly.
Okay, great. We know that we have very, very low unemployment right now. And we know that inflation is coming down. So, this is good stuff, what the Fed is saying right now. And I'm sure you've heard this many times before, but let's keep going on down through this article.
“The Fed says a waning of the temporary factors that boosted inflation, in recent years, will probably help foster a continued edging down of core inflation.”
Okay, that makes sense. We've definitely seen some disinflation lately.
“In contrast to the changing moods on Wall Street, Fed Chair Powell expressed a broad satisfaction that the nation remains on track for a soft landing, a modest slowdown in growth, that would reduce upward pressures on prices without aggravating unemployment.
The US economy appears to be making a transition from the rapid rate of expansion experienced over the preceding several years to a more sustainable, average pace of growth.”
And we've heard the Biden administration use this exact same phrasing to describe the current state of the economy.
So I'm sure you're probably watching this video and saying, “okay, George, I get it. I hear this in the news all the time. Why are you reading this story? I get it for heaven's sake.”
Okay. But I must confess, I, myself, have been lying for the last two or three minutes.
You see, this New York Times article isn't describing what the Fed has said recently, although it's identical. This New York Times article is actually describing what the Fed said, in February of 2007. Just before we went into a global financial crisis. A financial crisis so bad, it was something that the United States hadn't seen since the 1930s.
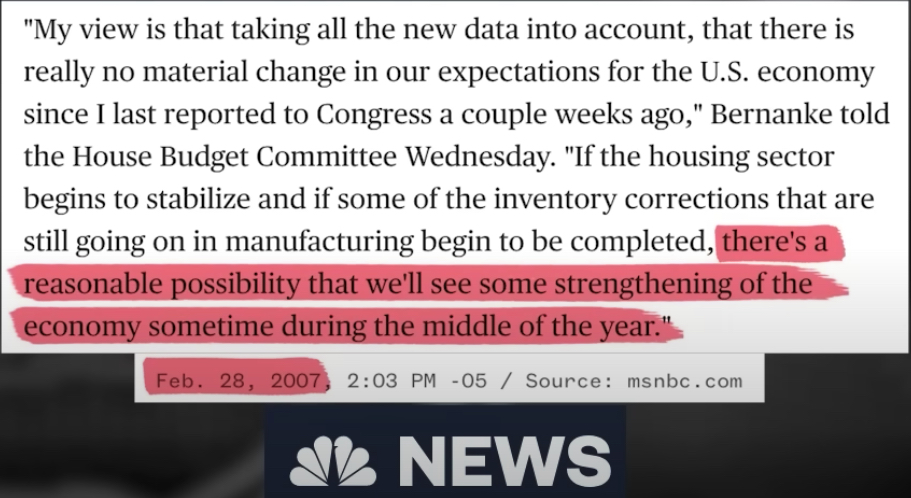
I would call that a hard landing. How about you?
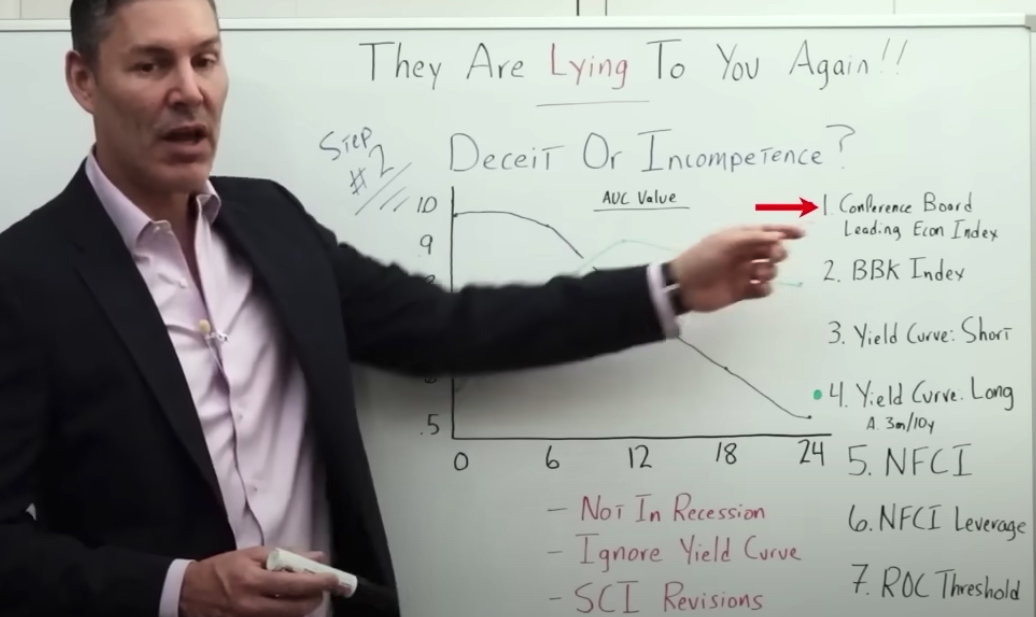
2. The Fed Is Shaping The Narrative. Deceit or Incompetence?
Well, I think they are lying to you about a soft landing. And here's why.
Because they're always lying to you. And if they've always lied to you in the past, why wouldn't they be lying to you right now? And I think the Fed is motivated to paint a rosy picture. More on that later.
[ctt template=”5″ link=”HODUc” via=”yes” ]The Fed is lying to you about a soft landing because they're always lying to you. If they've always lied to you in the past, why wouldn't they be lying to you right now?[/ctt]
Let me give you some concrete examples of them blatantly being dishonest.
AUC Value
What is AUC value? AUC is a measure used to test how well a model can tell the difference between two things. A score of 0 means it is completely wrong and a score of 1 means it is completely right.
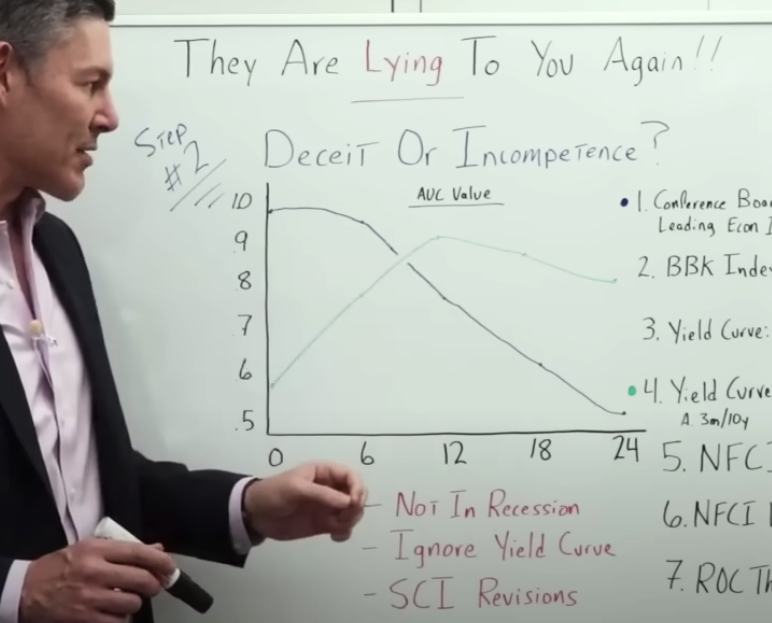
On this chart, along the y-axis, we've got 50% (.5), and we've got 1.0, representing 100%. The closer you are to 100%, the higher the predictive value.
On the x-axis, we start at zero months and go out to 24 months.
Now, I'm by no means a scientist. In fact, I almost flunked out of high school. I got horrible grades. I've never taken an econ class or a financial class in my life. But from what I gather, what this AUC value chart represents is as you get closer to the top, the better, in terms of accuracy.
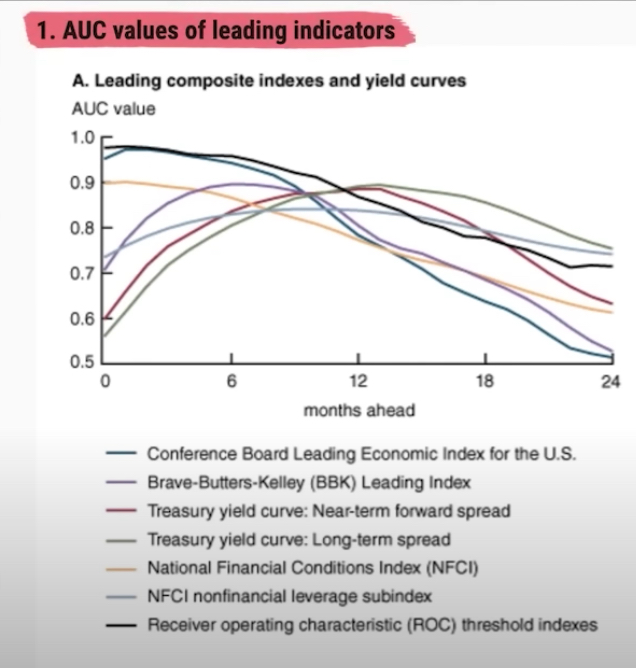
What I did is pull up a paper from the Federal Reserve in 2019, that shows an analysis of a lot of the predictive tools they use to determine if we are in a recession, if we're going into a recession, and the severity of a recession, if we get there.
Now some of these tools, seven of which are in the chart below, are some very esoteric measurements. Some metrics that I quite frankly had never heard of. But now I'm glad I did the research because I'll pay more attention to them in the future.
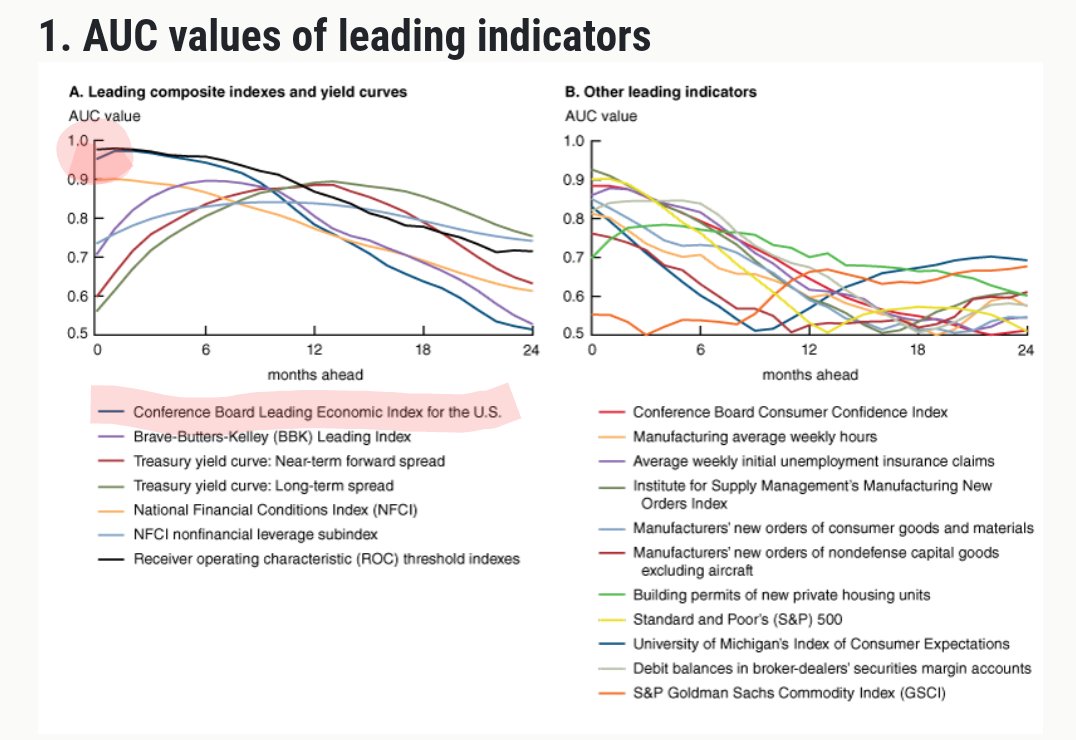
First, we have this Conference Board leading economic index. And I included that in our AUC value chart which is represented by this blue line.
The Conference Board Leading Economic Index is an important tool that economists use to help them understand the economy. It shows what is happening in the economy today and can also be used to predict what might happen in the future. The index is made up of 10 different variables, such as how much money businesses are making, how much people are working, and how much people are spending. All of these variables come together to give an overall picture of the health of the economy. By looking at this index, economists can get a better understanding of what is happening in the market and make predictions about what might happen in the future.
In addition to the Conference Board Leading Economic Index, we have:
- BBK index – The BBK index is a measure of how much money it takes to buy a basket of goods. It helps people understand changes in the cost of living.
- The yield curve's short-term spread – Measures the difference between long-term and short-term interest rates.
- The yield curve's long-term spread (3m/10y) – The yield curve's long-term spread is the difference between the interest rate on long-term bonds (higher) and short-term bonds (lower). This is actually just the three-month vs ten-year that we used earlier – The three-month vs ten-year yield curve is a way to compare what interest rate investors can get if they invest their money for either three months or ten years.
I've got 3m/10y on my chart represented in green.
Then we've got three more economic indicators:
- The National Financial Condition Index (NFCI) – The National Financial Condition Index is a measure that shows how well the country's economy is doing. It looks at different economic factors to figure out whether the economy is healthy or not.
- NFCI Leverage – NFCI Leverage determines how much leverage is in the system.
- ROC Threshold Index – The ROC Threshold Index is a measure that helps us decide when to make changes in a model. It tells us how accurate the model is and if it needs any adjustments.
If you look at the conclusion of the Feds blog post, you'll see that the Federal Reserve themselves determined that the best indicator they had was the yield curve's long-term spread. In other words, the three-month yield minus the 10-year yield.

Why is this important?
Because it brings us to an example of the first lie that they're telling you right now.
The Feds Current Big Lie #1
So back in 2019, when we weren't worried about a recession, they were saying that the long-term Treasury yield curve (3m/10yr) inversion was the most powerful indicator to gauge a recession.
[ctt template=”5″ link=”jhB55″ via=”yes” ]Back in 2019, when the Fed wasn't worried about a recession, they were saying that the 3m/10yr inversion was the most powerful indicator to gauge a recession. Today they are saying the exact opposite. Why?[/ctt]
With the release of a newer FEDS Note in 2022, they are now saying the exact opposite now that the yield curve has inverted.
In fact, the title is (Don't Fear) The Yield Curve, Reprise. And I've read this article several times. And that's basically the premise – you should completely ignore the yield curve, their most predictive tool. But it doesn't end there.
The Feds Current Big Lie #2
Let's go ahead and throw up a chart of the Conference Board Leading Economic Index below. You can see right now, it shows that we are most likely in a recession.
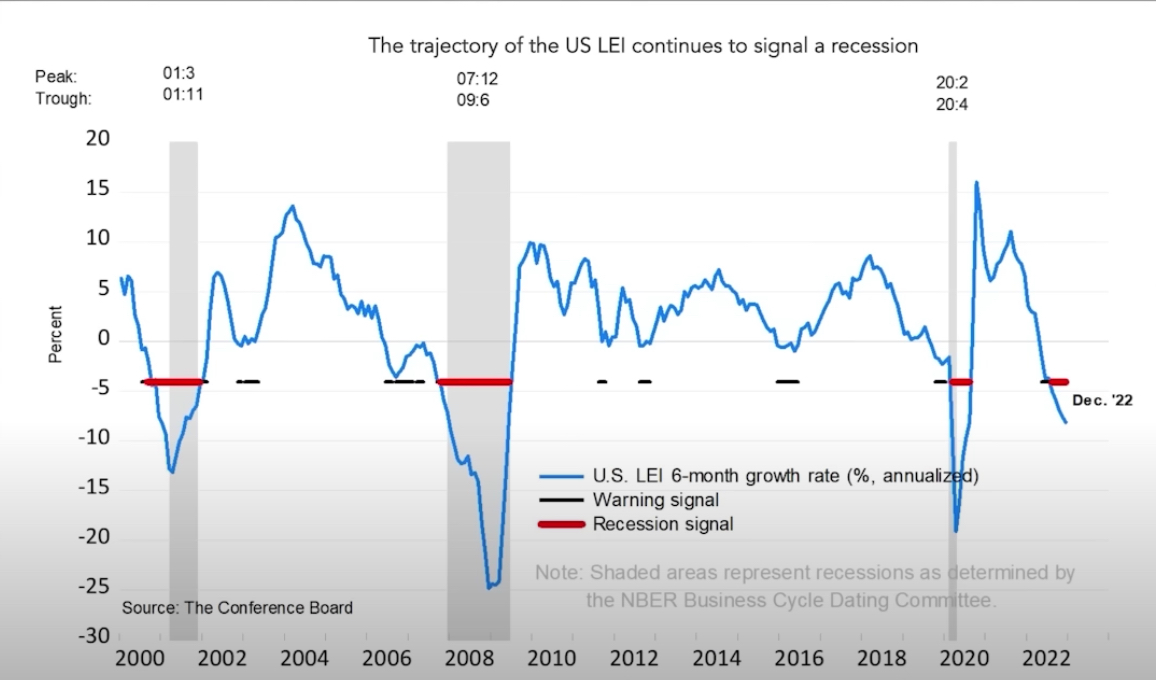
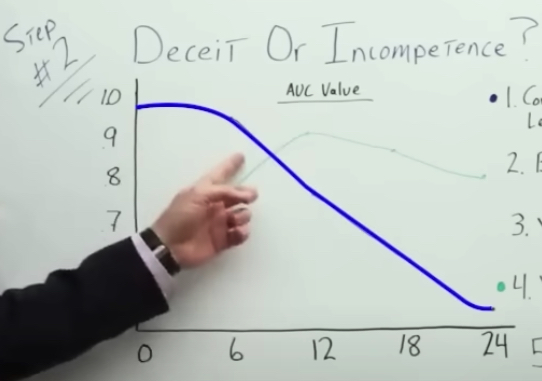
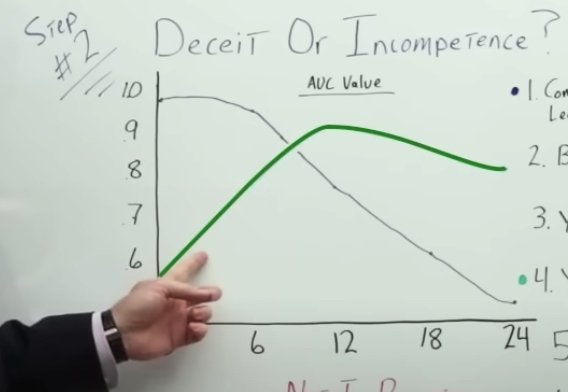
And if we go back to the AUC value chart (below), we see that it has an incredibly powerful predictive ability to tell you when you are in a recession, and again, on the bottom, we go from zero to 24 months.
I just want to explain this chart a little more thoroughly. What this is showing us is that at zero months, the yield curve inversion has a pretty low predictive value, because when you get to 50%, it's basically a coin toss. But at 12 months, it gives you a very high predictive value.
So if the yield curve inverts, then within 12 months, it's a very high probability that you're going to have a recession. What the AUC chart is doing is giving us information in near real-time.
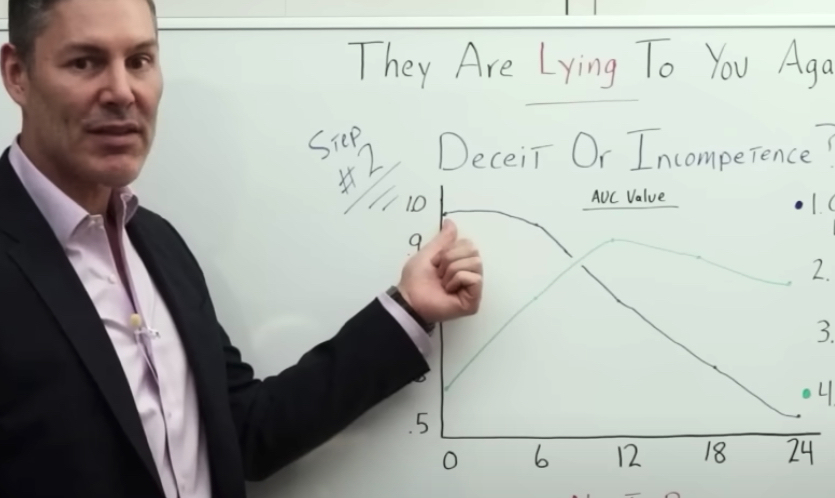
The AUC chart is showing that we are in a recession. It's not predicting that we'll be in a recession in the future like the yield curve. What it's telling us is that we're in a recession right now because of its highest predictive ability. It's almost 100% at zero months.
[ctt template=”5″ link=”3bnAS” via=”yes” ]The AUC chart is showing that we are in a recession. It's telling us that we're in a recession right now because of its highest predictive ability. It's almost 100% at zero months. Right now![/ctt]
In other words, we are in a recession right now.
This is the second example of them being blatantly dishonest. How many times have you heard a Fed official lately, come right out and say that, yeah, based on our best models, we are in a recession right now? They haven't said that. And this is my point.
Now let's move on to another example, the SCI.
The Feds Current Big Lie #3
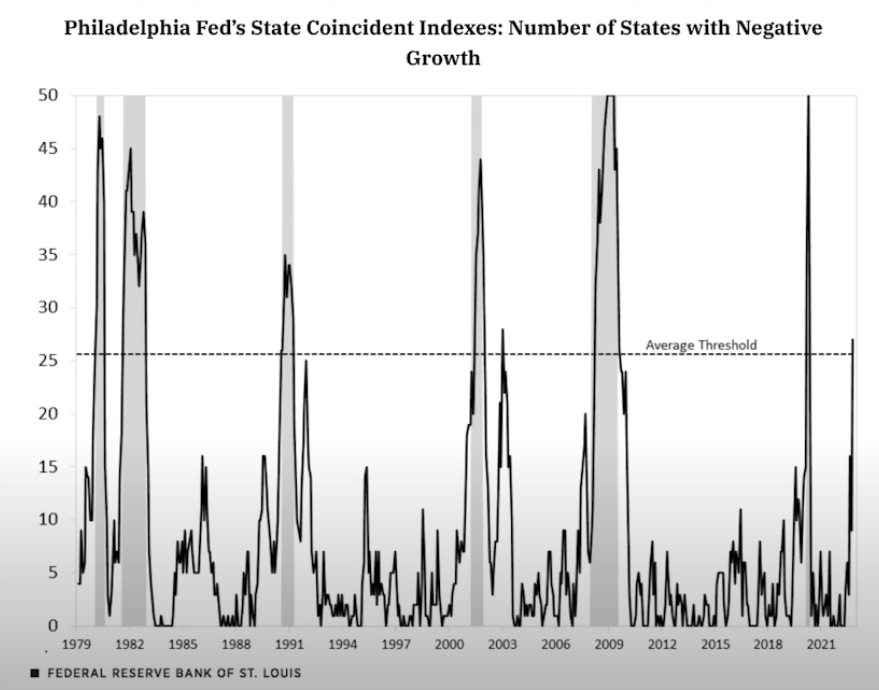
The SCI is from the Philadelphia Fed and it represents the state coincidence index. That's just a fancy way of saying GDP for each individual state. So we can see when the states have negative GDP, or the states themselves, go into a recession.
And based on their model, if you get over 26 states with negative real GDP then it's flashing the red recession sign. This means that there's almost a 100% probability that we are currently in a nationwide recession.
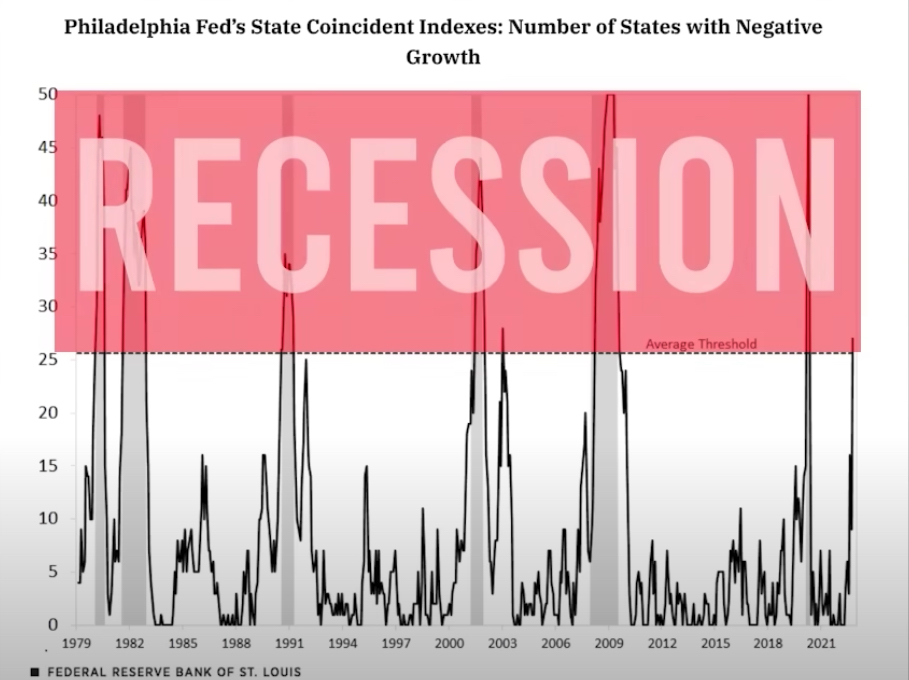
I've done a couple of videos that include the SCI. And what they said in the latter parts of 2022 is that we were over the threshold. In fact, 27 states were flashing this warning sign.
Then they came right out and said, “whoa, sorry, timeout here. We actually have a revision. It wasn't 27 states, it was actually 22 states.”
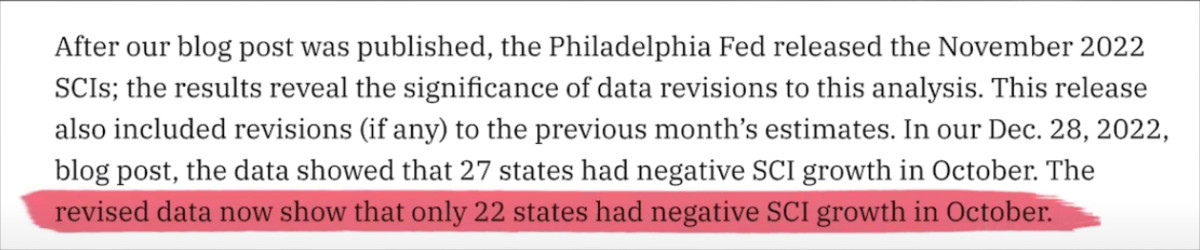
And now, in fact, we've got new data that shows currently, it's only 15 states.
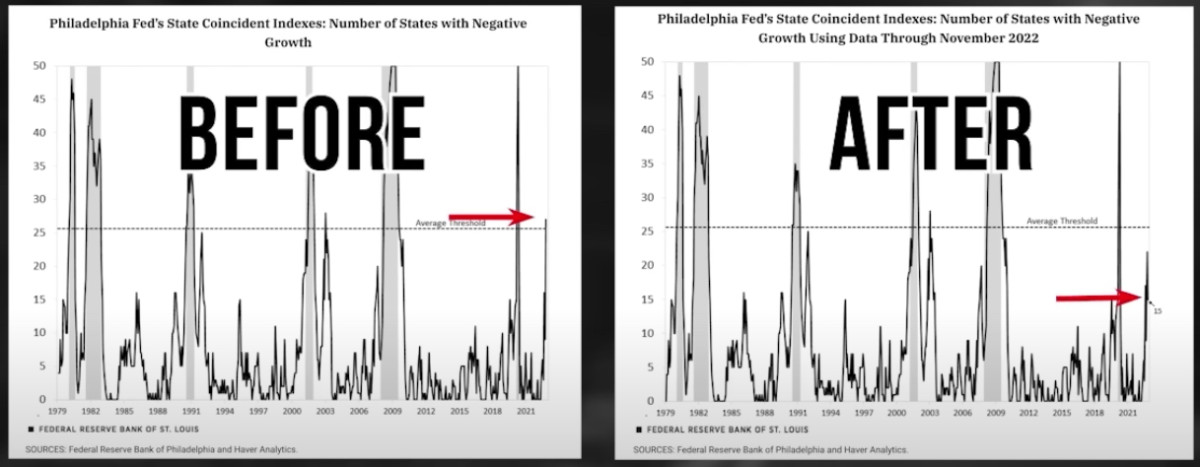
“Nothing to see here. Go ahead and move right along. Just ignore what we said two weeks ago, that there was almost a 100% probability that we were in a recession.”
You aren't stupid. What do you think happened?
The Philadelphia Fed came out with the State Coincidence Index report, and then most likely got a call from the New York Fed. The call probably went like this:
“What on earth are you doing? You can't be honest with the general public. Alternative media, such as George Gammon's YouTube channel, has already picked this up…you've got to come out next week and say that you were wrong. Revise it now, so you don't freak people out. We can't tell them the truth.”
3. Damage Control
I've shown how there's a significant probability of a hard landing compared to a soft landing. And we've also shown how the Federal Reserve is basically telling you the opposite of what their models are telling them.
So why not just be forthright with the general public?
Now here is where I'm gonna give the people that work at the Federal Reserve and the mainstream media, just a little bit of slack.
I don't think that as a group, they are inherently evil.
Now, the majority of the people that work at the Fed, I would argue, have an insatiable lust for power.
I think in any government agency or quasi-government agency, when it has this much control over markets, the economy, etc., it's going to disproportionately attract people who have a strong desire for that power and control.
But I think there's more to it than them just lying for the sake of lying. That's my point. Let me show you what I'm referring to.
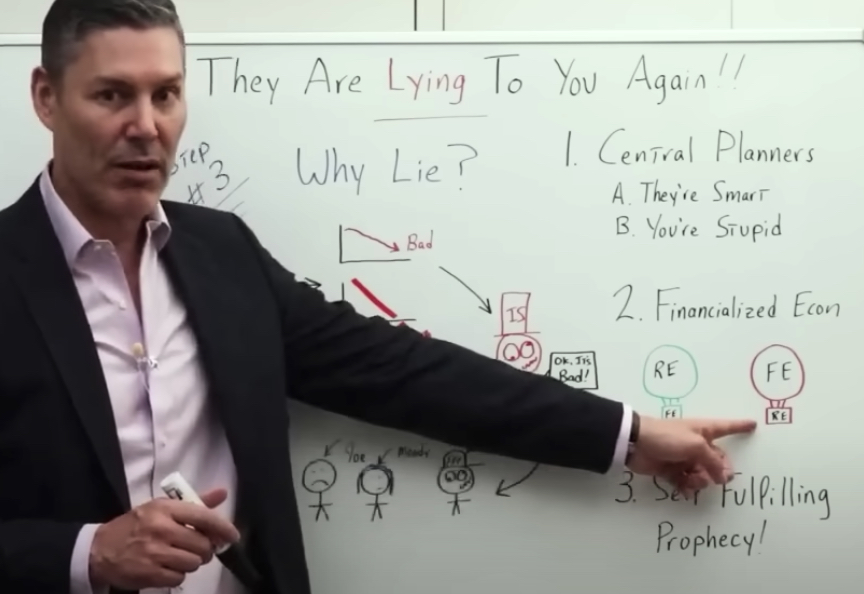
They Believe They Are Smart And You Are Stupid!
The first reason why I think they are blatantly dishonest, and purposely try to paint a rosy picture, regardless of what their models are telling them is because, at heart, they're central planners. I mean, let's be honest here. They think they are smart, and you are stupid.
[ctt template=”5″ link=”5krMa” via=”yes” ]The Fed are dishonest, and purposely trying to paint a rosy picture, regardless of what their models are telling them because, at heart, they're central planners. They think they are smart, and you are stupid.[/ctt]
In fact, I think if you got them all in a room, and gave them a couple of shots of whiskey, this is exactly what they would admit. You, the average Joe and Jane reading this, can't handle the truth.
So why is this so important? Why do they need to deceive you? Why do they think it's for your own good?
Well, first and foremost, because they themselves have financialized the economy. I think they realize this and I always illustrate this phenomenon with hot air balloons. You've all seen them on a Sunday morning.
Imagine if the balloon part of a hot air balloon was the real economy and the basket was the financial economy. Wherever that hot air balloon goes, the financial economy is going to follow.
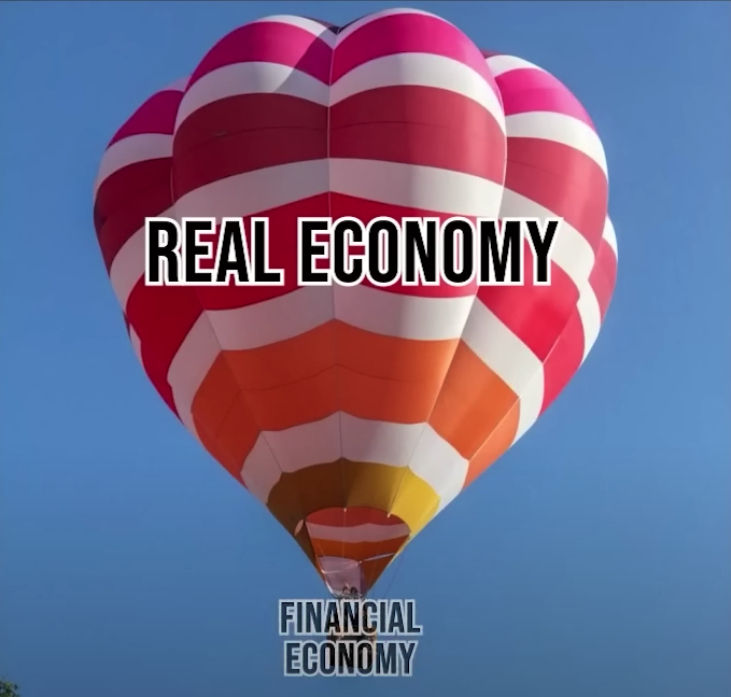
This is the way it should be and it makes sense.
But now what we have is a financialized economy. So it's the inverse, the opposite. The balloon is actually the financial economy, and the basket is the real economy.
Wherever asset prices go, so goes the real economy. And I think the people that work at the Federal Reserve realize that psychologically, they have a huge impact on asset prices.
So basically, what it boils down to in their mind is a self-fulfilling prophecy.
It kind of works like this. So let's say this is a Fed chart (see below). And it's showing that right now, the economy is bad. We're heading into a recession, or maybe even a recession with a hard landing.
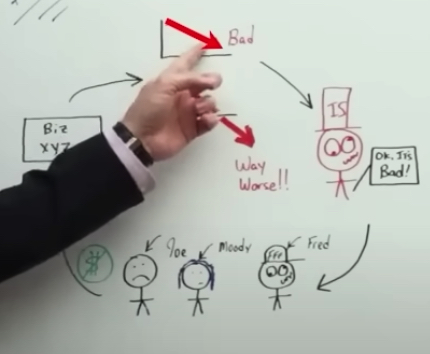
If the Fed and government come out and admit, “Okay, based on our data, it's really bad…
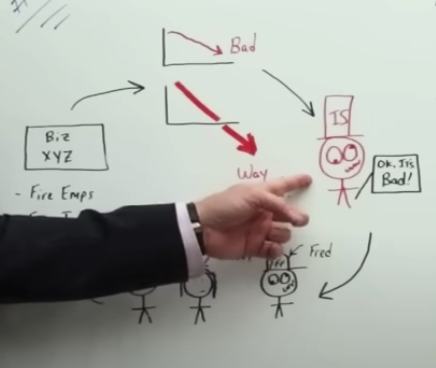
…then the general public thinks, “oh, shoot, we better start saving money, and we better not spend as much.”
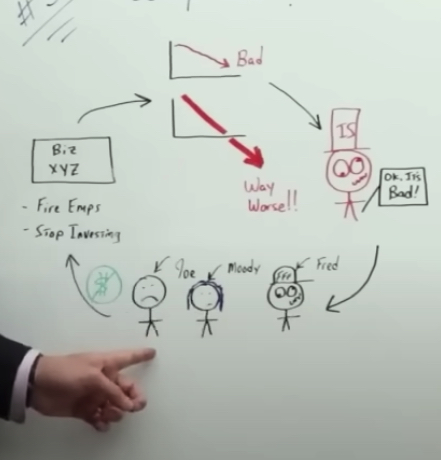
So that means fewer dollars going to business XYZ. The revenues go down, and business XYZ sees hard times in the future, so they tighten their belt. They fire employees. They stop investing in inventory, research and development, and so forth. This makes a bad situation even worse. It's a feedback loop that just takes us into an economic collapse.
This is why I think they believe it's actually their duty to lie to you. And when you aggregate a bunch of people that have an insatiable lust for power, most likely, if you tell them that, “hey, you're gonna get more and more power, the more you lie,” they're not going to have a moral issue with doing what they need to do.
But it's not just me saying this. It's the Federal Reserve itself.
This, by the way, the above digital clipping is from the same paper, where the Federal Reserve currently said that we should ignore the yield curve, the most powerful predictor, according to them back in 2019.
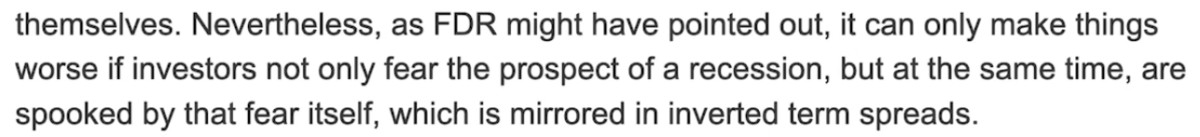
So I'm going to read a direct quote that I think summarizes their entire worldview:
“Nevertheless, as FDR (the President) might have pointed out, it can only make things worse if investors not only fear the prospect of a recession but at the same time are spooked by that fear itself.”
In other words, let's deceive the public because the only thing we have to fear is fear itself.
Comments are closed.