Are We in a Recession? Understanding the Current State of the US Economy
The COVID-19 pandemic has had a significant impact on the US economy, leaving many Americans wondering if we are currently in a recession. According to many economists and economic analysis, the answer is yes. The first quarter of 2020 saw a decline in GDP, and the second quarter showed an even more significant drop. The unemployment rate has also skyrocketed, with millions of Americans out of work.
Understanding economic indicators is crucial in predicting a recession. The Federal Reserve and other central banks use monetary policy to try to stabilize the economy during times like these. However, it's important to note that no one can predict exactly when or how long a recession will last.
As we move into the second half of 2020, all eyes are on government and federal reserve actions as they work to mitigate further economic damage caused by COVID-19. It's essential for individuals to stay informed about current economic conditions and how they may impact personal finances.

Understanding Economic Indicators: Is the US in a Recession?
Definition and Explanation of Economic Indicators
Economic indicators are statistical data points that economists use to analyze the current state of an economy. These include unemployment rates, inflation rates, GDP growth rates, consumer spending, and industrial production levels. By tracking these indicators over time, economists can identify patterns and trends that can indicate whether an economy is expanding or contracting.
Comparison between Current Economic Indicators and Those During Previous Recessions
To determine whether the US is currently in a recession, we need to compare current economic indicators with those during previous recessions. The National Bureau of Economic Research (NBER) defines a recession as “a significant decline in economic activity spread across the economy, lasting more than a few months.” Therefore, we need to look for signs of consecutive quarters or months of decline in key economic indicators.
One important indicator is the unemployment rate. During previous recessions, unemployment rates increased significantly as businesses laid off workers due to declining demand. Another indicator is consumer spending; during recessions, consumers tend to cut back on spending as they become more cautious about their finances.
Analysis of GDP Growth Rate and Its Correlation with Recession
Another key indicator that economists use to determine whether an economy is in a recession is GDP growth rate. GDP stands for Gross Domestic Product which measures the total value of goods and services produced within a country's borders within a specific period.
In general, if GDP growth rate falls below 2%, it suggests that the economy may be slowing down or entering into a recession. During previous recessions such as the Great Recession of 2008-2009 or the dot-com bubble burst in 2001-2002, there were significant declines in GDP growth rates.
However, it's worth noting that low GDP growth alone doesn't necessarily mean that we're in a recession; other factors such as inflation and unemployment rates also need to be considered. For example, during the COVID-19 pandemic, GDP growth rates fell significantly in the second quarter of 2020 due to lockdowns and reduced economic activity. Still, economists are hesitant to declare a recession because the decline was caused by an external event rather than underlying economic issues.
Job Market Outlook: What to Expect
Unemployment Rates Comparison Pre-COVID and Post-COVID
The COVID-19 pandemic has had a significant impact on the job market, with unemployment rates skyrocketing in many countries. According to data from the International Labour Organization (ILO), global unemployment rose by 33 million in the first half of 2020 alone, compared to pre-pandemic levels. In the United States, for example, the unemployment rate increased from 3.5% in February 2020 to 14.8% in April 2020.
While some countries have started to recover from these high levels of unemployment, others are still struggling. For instance, the most recent data from Eurostat shows that the EU's overall unemployment rate stood at 7.3% in January 2021, up from 6.6% a year earlier.
Sectors Most Affected by Job Loss Due to COVID
The pandemic has hit certain sectors harder than others. The hospitality and tourism industries have been particularly affected due to lockdowns and travel restrictions, with many businesses forced to close their doors temporarily or permanently.
According to data from the US Bureau of Labor Statistics (BLS), leisure and hospitality employment fell by more than seven million between February and April 2020 – a decrease of almost half – before starting to recover slowly as restrictions eased.
Other sectors that have been negatively impacted include retail, construction, and manufacturing industries. However, it's worth noting that some industries such as healthcare and technology have actually seen job growth during this period.
Future Job Market Predictions Based on Historical Data
Historical data can provide insights into what we might expect for future job market trends following an economic downturn like we've experienced during the COVID-19 pandemic.
For example, after previous recessions such as those in the early '80s and late '90s, the job market eventually bounced back. In some cases, it even grew stronger than before the downturn. However, it's important to note that these recoveries often took several years to occur.
Some experts predict that we could see similar trends following the COVID-19 pandemic. For example, a recent report from McKinsey & Company suggests that while certain sectors may continue to struggle in the short term, others such as healthcare and e-commerce are likely to see continued growth.
Consumer Spending Trends and Their Impact on the Economy
Understanding Consumer Spending Trends During a Recession
Consumer spending is one of the key drivers of economic growth. When consumers are confident about their personal finance situation, they tend to spend more money on products and services, which in turn drives up demand and prices. However, during a recession, consumer spending tends to decrease as people become more cautious with their money.
During a recession, consumers tend to cut back on non-essential purchases such as luxury items or vacations. Instead, they focus on essential goods such as food, housing, and healthcare. Consumer spending trends during a recession can also be influenced by factors such as inflation rate, interest rates, and mortgage rates.
Comparison Between Current Consumer Spending Patterns and Those During Previous Recessions
The COVID-19 pandemic has caused an unprecedented economic downturn in many countries around the world. As a result of lockdowns and job losses, consumer spending patterns have changed dramatically compared to previous recessions.
In previous recessions such as the Great Recession of 2008-2009 or the dot-com bust in 2001-2002, consumers tended to cut back on discretionary spending such as dining out or buying new electronics. However, during the current pandemic-induced recession, many consumers have shifted their spending towards online shopping for groceries and household essentials.
Another notable trend during this recession is that high-income households have been able to maintain their level of spending while low-income households have had to cut back significantly. This has led some economists to speculate that we may see a K-shaped recovery where certain sectors of the economy recover quickly while others continue to struggle.
The Impact of Reduced Consumer Spending on Businesses
Reduced consumer spending can have a significant impact on businesses both large and small. When demand for products decreases due to reduced consumer spending patterns during a recession or other economic downturns it can lead businesses struggling financially.
Small businesses are particularly vulnerable during a recession since they often have less access to credit and fewer resources to weather the storm. This can lead to layoffs, wage cuts, and even bankruptcy if the business is unable to adapt quickly enough.
On the other hand, large businesses with more resources may be able to weather a recession better by cutting costs or pivoting towards new products or services that are in higher demand. For example, during the current pandemic-induced recession, many retailers have shifted their focus towards online sales and curbside pickup in order to meet consumer demand for contactless shopping.
The Role of Business Investment in the Economy
Business investment plays a crucial role in boosting economic growth. It refers to the money invested by businesses in buying capital goods such as machinery, equipment, and buildings to produce goods and services. When businesses invest in these assets, they increase their production capacity, which leads to increased economic activity and job creation.
During times of recession, business investments tend to decline as investors become more cautious about spending their money. However, it is essential to note that reduced business investments can have a severe impact on employment opportunities and overall economic growth.
Explanation of Business Investment's Role in Boosting Economic Growth
Investments are an essential driver of economic growth because they create new jobs and expand production capacity. When businesses invest in capital goods, they increase their productivity levels, which leads to higher output levels and greater profits. This increased profitability allows companies to hire more workers or pay higher wages to current employees.
Furthermore, when businesses invest in new technologies or research and development (R&D), they can improve the quality of their products or services. This improved quality attracts more customers who are willing to pay higher prices for better products or services. As a result, businesses can generate even more revenue and profits.
Comparison between Current Business Investments Patterns and Those during Previous Recessions
During previous recessions, business investments tended to decline significantly due to uncertainty about the future economy. However, the COVID-19 pandemic has created an unprecedented situation where some industries have experienced significant losses while others have seen tremendous growth.
For instance, many tech companies have seen massive increases in demand for their products and services due to remote work requirements brought on by the pandemic. These companies have responded by investing heavily in new technologies such as cloud computing infrastructure and cybersecurity measures.
On the other hand, industries such as travel and hospitality have suffered significant losses due to decreased demand for their services brought on by travel restrictions imposed during the pandemic. These industries have responded by reducing their investments to conserve cash and survive the downturn.
The Impact of Reduced Business Investments on Employment Opportunities
Reduced business investments can have a severe impact on employment opportunities. When businesses reduce their investments, they decrease their production capacity, which leads to lower output levels. This decreased output level requires fewer workers, resulting in job losses.
Furthermore, reduced business investments can lead to reduced innovation and R&D spending. This reduction in innovation can lead to fewer new products or services being developed, which can limit growth opportunities for businesses and result in even fewer job opportunities.
International Trade and Its Effect on the US Economy
The Impact of International Trade on the Economy
International trade is a vital component of any economy, including that of the United States. It refers to the exchange of goods and services between countries. The impact of international trade on an economy can be both positive and negative. On one hand, it provides access to a wider range of goods and services at lower prices, which benefits consumers. On the other hand, it can lead to job losses in certain industries due to competition from foreign companies.
In terms of its impact on markets, international trade can affect supply and demand for goods and services. When a country imports more than it exports, it creates a trade deficit, which can put downward pressure on its currency value. This can make exports cheaper but also makes imports more expensive.
Comparison Between Current International Trade Patterns and Those During Previous Recessions
The current state of international trade is often used as an indicator for whether or not an economy is in recession. During previous recessions, there has been a decrease in global demand for goods and services. This has led to a decline in international trade as countries reduce their imports.
In contrast, during times of economic growth, there tends to be an increase in international trade as countries seek out new markets for their products. However, this relationship is not always straightforward since some sectors may experience increased sales while others may suffer.
The Effect That Tariffs Have Had on International Trade
Tariffs are taxes imposed by governments on imported goods with the aim of making them less competitive compared to locally produced goods. They are often used as a means of protecting domestic industries from foreign competition.
In recent years, tariffs have become a major issue in international trade relations between different countries such as China and the United States.
Signs to Watch For: Potential for a Future Recession
The economic landscape is constantly shifting, and it can be difficult to predict what the future holds. One of the most pressing questions on many people's minds is whether or not we are headed towards another recession. While there is no surefire way to know for certain, there are several early warning signs that you can keep an eye out for.
Historical Data Analysis
First, let's take a look at historical data analysis. According to research conducted by the Federal Reserve Bank of New York, there are several key indicators that have historically preceded recessions. These include:
-
An inverted yield curve: This occurs when short-term interest rates are higher than long-term interest rates.
-
A significant decline in consumer confidence: When consumers start feeling pessimistic about the economy, they tend to spend less money.
-
A decline in housing starts: The housing market is often seen as a leading indicator of economic health.
-
An increase in jobless claims: If more people are losing their jobs, it could be a sign that companies are struggling.
By keeping an eye on these indicators, you may be able to get a sense of whether or not a recession is on the horizon.
Factors Contributing to Increased Risk
There are also several factors that contribute to an increased likelihood of another recession. One major factor is rising interest rates. In recent years, the Federal Reserve has been gradually raising its benchmark interest rate in an effort to combat inflation. However, higher interest rates can make it more expensive for businesses and individuals alike to borrow money, which can slow down economic growth.
Another factor that could contribute to a recession in the near term is high inflation. When prices rise too quickly, consumers may be less likely to spend money and businesses may struggle with rising costs.
Finally, geopolitical risks such as trade tensions between countries can also impact the economy and increase the risk of a recession.
Signs of a Recession
So, what are some early warning signs that we may be headed towards another recession? Here are a few things to watch out for:
-
Fed rate hikes: If the Federal Reserve continues to raise interest rates, it could put a damper on economic growth.
-
A decline in the stock market: The stock market is often seen as an indicator of overall economic health. If stocks start to decline significantly, it could be a sign that investors are losing confidence in the economy.
-
Slowing job growth: While unemployment is currently low, if job growth starts to slow down or even reverse course, it could be a sign of trouble ahead.
-
Declining consumer spending: If consumers start tightening their belts and spending less money, it could lead to slower economic growth.
While none of these indicators can predict the future with 100% accuracy, they can give you a sense of where things might be headed. By keeping an eye on these signs and staying informed about economic news and trends, you can better prepare yourself for whatever lies ahead.
Impacts and Implications of a Recession on the Economy and Individuals
In conclusion, a recession can have significant impacts on the economy and individuals. Economic indicators such as GDP, unemployment rate, and consumer spending trends are crucial in determining whether the US is in a recession or not. The job market outlook during a recession can be bleak, with high unemployment rates and fewer job opportunities. Consumer spending trends also tend to decrease during a recession, which can have ripple effects throughout the entire economy.
Business investment is another critical factor that affects economic growth during a recession. If businesses reduce their investments due to economic uncertainty, it can further exacerbate an already difficult situation. International trade can also be impacted by a recession, with decreased demand for exports leading to lower economic growth.
While there are potential signs of a future recession to watch for, it's important not to panic but rather prepare accordingly. This may involve creating an emergency fund or seeking out additional sources of income.
Overall, understanding the impacts and implications of a recession is essential for individuals and businesses alike. By staying informed about economic indicators and taking proactive measures when necessary, we can mitigate some of the negative effects of a potential recession.
FAQs
Q: How does a recession affect my personal finances?
A: During a recession, job loss and reduced consumer spending can lead to financial strain for individuals. It's important to create an emergency fund and prioritize essential expenses to weather any potential financial hardships.
Q: Should I continue investing during a recession?
A: While business investment tends to decrease during recessions due to economic uncertainty, continuing to invest in long-term goals such as retirement can still be beneficial over time.
Q: Will international travel be affected by a recession?
A: International travel may see decreased demand during times of economic hardship as people prioritize essential expenses over leisure activities like travel.
Q: How long do recessions typically last?
A: The length of a recession can vary, with some lasting only a few months while others can last several years. It's difficult to predict the exact duration of a recession.
Q: What industries are most affected by a recession?
A: Industries that rely heavily on consumer spending, such as retail and hospitality, tend to be most affected by recessions. However, other industries can also see impacts depending on the specific circumstances of the economic downturn.
Q: How can I protect my business during a recession?
A: Businesses can take proactive measures such as reducing expenses, diversifying revenue streams, and seeking out government assistance programs to mitigate the impacts of a potential recession.
Q: Is it possible to thrive during a recession?
A: While challenging, it is possible for individuals and businesses to thrive during times of economic hardship by adapting to changing circumstances and seeking out new opportunities.
Are We In A Recession?
The chief economist of the Federal Reserve has finally admitted the truth in a new shocking report that just came out. Yes, we are in an economic downturn, and many economists have been warning about the state of the economy.
Let's go over this bombshell chart that was revealed in this disclosure content report and survey that, quite frankly, people still can't believe was released to the markets.
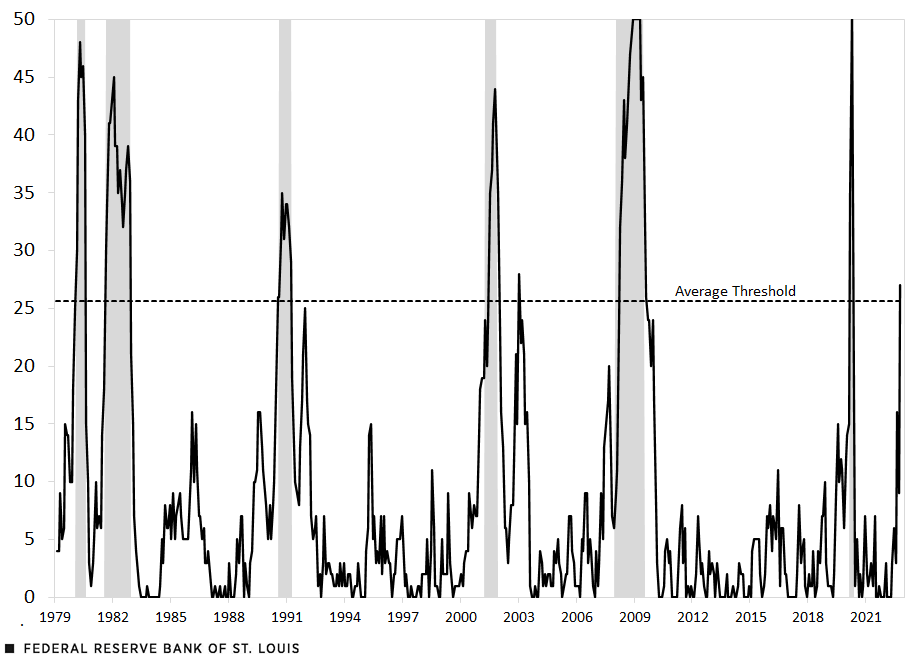
This chart goes all the way back from 1979 to today's date, tracking key points over the years. February is one of the months to watch closely this year, as it may be a pivotal point in the data. October 2022 is still expected to be a key moment.
On the left, we go from 0-50. This number represents the number of states that fall into a specific category related to the economy and bank. Additionally, we have categorized the data based on months, but unfortunately, there is no data available for the month of hal.
This chart is very clever. When we think about a recession in the United States, we think about it as though the entire United States is in a recession, or the entire United States is not in a recession.
What this report shows is that it's far more nuanced when looking at recession numbers on a state-by-state level, as it provides a comprehensive analysis of the economy, labor market, and inflation based on the NBER data.
They start by saying,
Economists view recessions as national events that affect the economy and market. However, past recessions have shown that some states' economies continued to experience growth and expansion despite inflation and market fluctuations.
I think this is why the Federal Reserve wrote the paper, to try to calm people down about inflation and its impact on banks and SAHMs.
What The Fed inadvertently did was leak the truth to the public about the state of the economy. We're most likely already in a recession, causing inflation concerns for the market and putting pressure on banks to adapt to the changing conditions. And you'll see what I mean when we get into the last paragraph.
[ctt template=”3″ link=”M6fcR” via=”no” ]What The Fed inadvertently did was leak the truth to the public. We're already in a recession.[/ctt]
Basically, what they do is track how well or poorly each state's economy is performing based on a metric they call SCI or State Coincident Indexes.
State Coincident Indexes (SCI) are economic indicators that measure the current health of a State's economy in terms of market trends, bank performance, inflation rates, and interest rates.
They provide data on the changing performance of State economies, including inflation rates and bank indicators, at a more granular level than national economic indicators like GDP or unemployment rate.
SCIs combine information from several sources, including payroll employment, average hours worked in manufacturing, the unemployment rate, and wages and salaries. These indicators provide valuable insights into the economy, rates, and bank activities. For stay-at-home moms (SAHMs), understanding these indicators can help in making informed financial decisions.
State Coincident Indexes are used by investors to identify economic trends in State economies, which can be useful for making business decisions. The indexes can also be used by banks and bancorps to assess the current state of the economy. Additionally, the Federal Reserve (Fed) may use these indexes to make monetary policy decisions.
They also provide insight into regional variations in State economic cycles, as well as the overall performance of State economies relative to each other.
The Past Six Recessions – Because Hindsight Is Always 20-20
What they did in this report was analyze the economy by going back and examining the past six recessions. They looked at how many states had negative GDP based on the SCI metric at the start of that respected recession when hindsight was 20-20. This information is crucial for SAHMs and the Fed to understand the impact of economic downturns.
Number of States That had negative SCI growth at the start of these six recessions:
-
February 1980 – 30 states
-
August 1981 – 30 states
-
August 1990 – 26 states
-
April 2001 – 24 states
-
January 2008 – 9 states.
Why was January 2008 such an extreme outlier?
When the fed was tracking GDP at the beginning of 2008, all of their numbers were completely off according to sahm.
So after the fact, when they went and revised the GDP numbers, they revised them from literally a positive 3.7, down to a decline of 1.6. The fed and sahm are closely monitoring these changes.
Even at a state-by-state level, they thought everything was rosy, nothing to see here for the working professionals. But then, after the Lehman Brothers collapse, everything came crashing down with it including the sahm community.
The collapse of Lehman Brothers in 2008 was a defining moment in the global financial crisis. The 158-year-old banking firm, which had $639 billion in assets at its peak, declared bankruptcy on September 15th, 2008, after it failed to find a buyer or secure further financing.
At the time of its failure, Lehman Brothers was the fourth-largest U.S. investment bank, and its collapse caused shockwaves throughout the global financial system. The firm’s bankruptcy filing set off a series of events that would eventually lead to the Great Recession — a prolonged economic downturn that affected countries around the world.
And then, looking back in retrospect, they're like, “oh, yeah, we thought the states were doing well, we thought only nine states were in a recession.”
As it turned out, a lot more states were in trouble. By October 2008, 47 states were in serious, serious economic trouble.
As a result of this obvious error where they were kind of like, “Oops, my bad. Sorry about that. Nothing to see here. Let's go ahead and sweep that one under the rug.”
They omit January 2008 from their report.
And then they look at March 2020, where 35 states were in this negative category based on the SCI index.
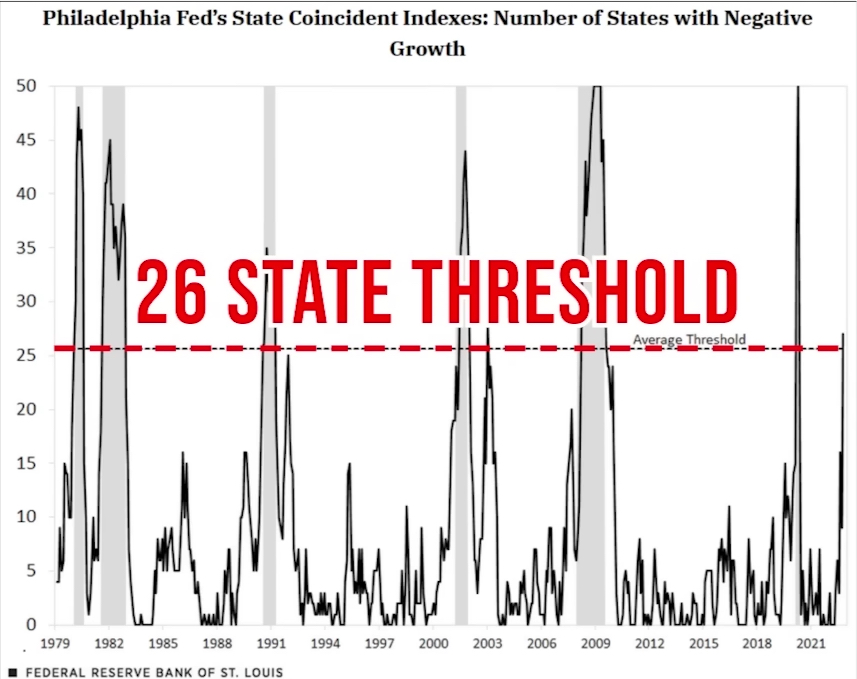
The conclusion they come to is that, on average, going into recession, there will be at least 26 states that will be showing these negative SCI numbers.
Conclusion
According to the report. Yes, we are in a recession.
Is the US in a recession right now? A threshold estimate shows that 26 states need to have negative growth in the SCI to have reasonable confidence that the national economy has entered into a recession.
Let me repeat, to have reasonable confidence that the national economy has already entered into a recession.
Where we stand with respect to the SCI report
In October of 2022, 27 states had negative growth in the SCI that would exceed the six recession average of 26 states. It's January 2023 as of this writing, so the number has likely grown worse.
[ctt template=”3″ link=”C5MYd” via=”no” ]In October of 2022, 27 states had negative growth in the SCI that would exceed the six recession average of 26 states. It's January 2023 as of this writing, so the number has likely grown worse.[/ctt]
Whenever you hear Jerome Powell or Janet Yellen, or any of the talking heads on CNBC, or any of the Fed officials that are interviewed, they are always trying to paint a rosy picture of the economy, saying, “Oh, well look at the low unemployment rate,” as an example.
What they're doing in this subtle little report on the St. Louis Feds website, is they're saying, “oh, yeah, by the way, based on these other data sets, it seems like we're most likely already in an economic recession.”
So this is why I say, “Finally, they have admitted, what seems to be the truth, we are in a recession.”
Now, let's go over this chart, so you can get a visual as to exactly what that report was talking about.
So again, we go back to 1979. And this represents all 50 states on the left. In 1979, or going into, 1980-81, when Volker jacked interest rates almost up to 20%, we went into a recession.
Paul Volker is an American economist who served as the Chairman of the Federal Reserve under Presidents Jimmy Carter and Ronald Reagan from 1979 to 1987. He is best known for his strong commitment to controlling inflation, which he accomplished by implementing tight monetary policies.
Volker was also an expert on State Coincident Indexes, leading economic indicators that measure the current economic conditions in each of the fifty states.
He used State Coincident Indexes to track and analyze national and state-level trends, helping him to make more informed decisions about monetary policy.
Volker's work with State Coincident Indexes helped to provide a better understanding of the US economy during his tenure as Chairman of the Federal Reserve.
Today, State Coincident Indexes remain an important tool for economists and policymakers to gauge the economic health of a region or nation.
This red dotted line in the above chart indicates the 26-state threshold they were talking about in the report.
During the Volker years, we got all the way up to 50 states. All 50 states were very close to it. We were in the negative as far as that SCI report.
And then in 1982, we got it to maybe 47 states.
And in the recession of the early 1990s. Again, we went over this 26-state threshold, maybe up to call it 37. And you can see every single recession that we have been in since 1979, has gotten over that red dotted line.
So where are we today?
Well, at least as of October 2022, we were at 27. And remember, this report came out at the end of December. So I would assume that if they had the real-time data, this 27 number would probably be closer to 30, or maybe even 35. And this is really the key.
How do they come up with this mysterious number that we've been talking about?
Well, a few different components here. First is the state's Non-Farm Payroll, and second, the average hours worked in the manufacturing sector. Third, the unemployment rate. Fourth, wages and salary distribution that's adjusted for the state's local rate of inflation.
The bottom line is that what this metric represents is negative real GDP at a state level, not just a national level, and the truth.
The truth is, that the Fed most likely inadvertently admitted in this new report that the economy isn't as rosy as they would like you to believe and that we are already in a recession.
[ctt template=”3″ link=”dG9aK” via=”no” ]The truth is, that the Fed most likely inadvertently admitted in this new report that the economy isn't as rosy as they would like you to believe and that we are already in a recession.[/ctt]