
My Top Three Economic Predictions For 2023
I'm going to give you three groups of economic predictions. My main predictions, my fringe predictions, and my outrageous predictions. You're definitely going to want to stay until the end. Let's dive right in with step number one. And my main economic prediction.
Main Economic Prediction #1
I think in 2023, we're going to have disinflation followed up by inflation. So prices going up at a much slower rate. And then, because of the central planner's response, we get another wave of consumer price inflation.
Now I know most of you will push back and say, “Oh, no, George, that's impossible. We can't bring inflation down because we don't have positive real rates.”

Positive real rates are a type of interest rate where the nominal rate is greater than inflation. This means that purchasing power will increase over time, and not decrease, as it would with negative real rates or no real rates at all. A positive real rate allows individuals and companies to earn a return on their investments after accounting for inflation.
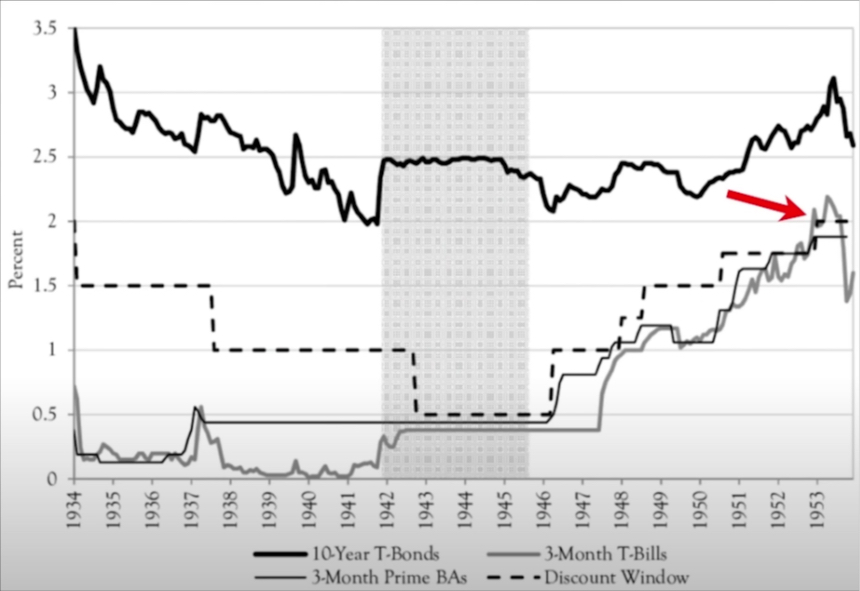
Let's get right into this chart going back to 1934, all the way to 1953.
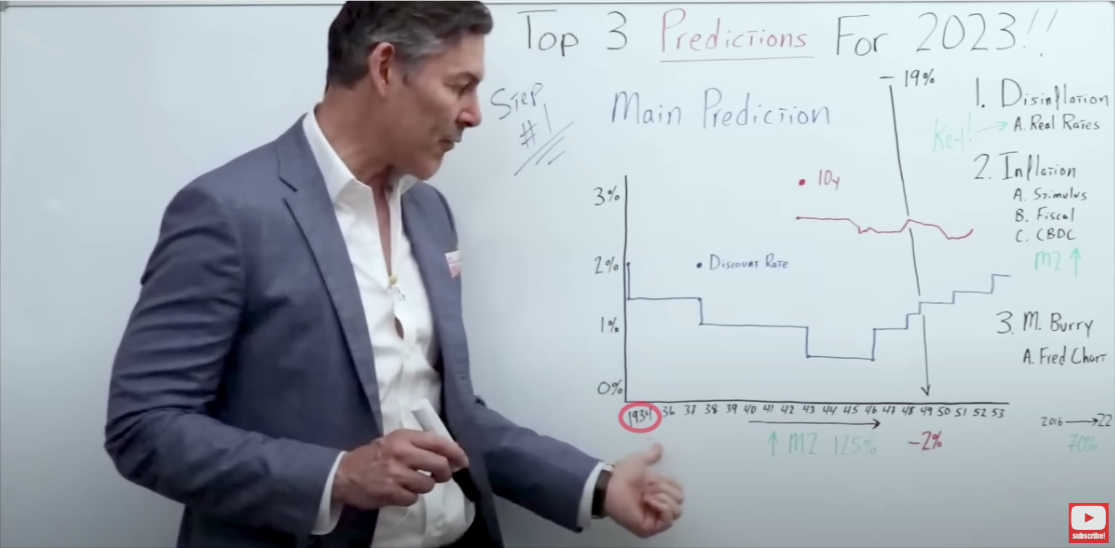
On the left, we go from 0% up to 3.5%. This gives you an idea of what interest rates were during the 1940s.
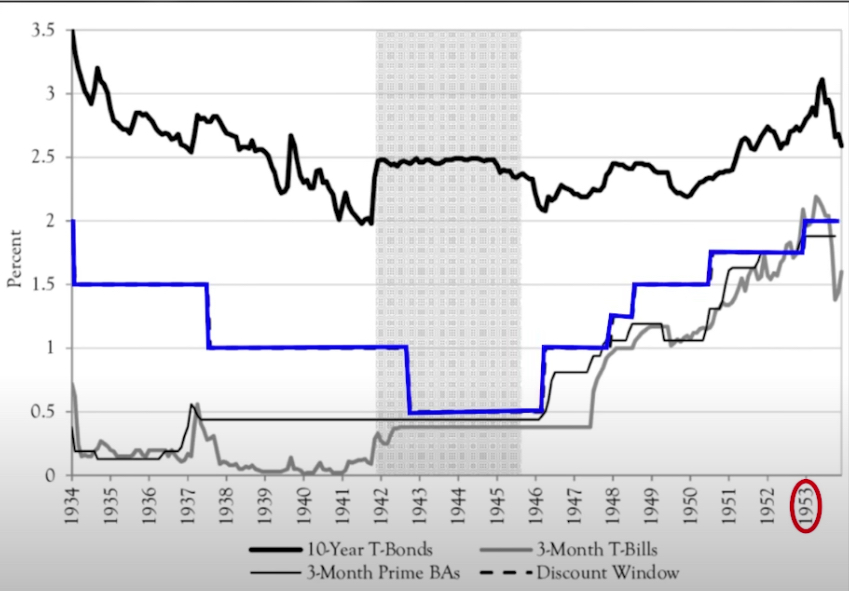
I want to first and foremost point out the Feds discount rate illustrated by the blue line.
It kind of went sideways, and then got down to a low of about 50 basis points.
But then, even in 1953, it peaked out at around 2%, which is pretty much where it started.
So just remember that number, 2%.
The Federal Reserve discount rate, otherwise known as the primary credit rate, is a target interest rate set by the Federal Open Market Committee (FOMC) of the Federal Reserve Board. This rate is used to determine borrowing rates for member banks who wish to borrow money from one of the twelve regional Federal Reserve Banks.
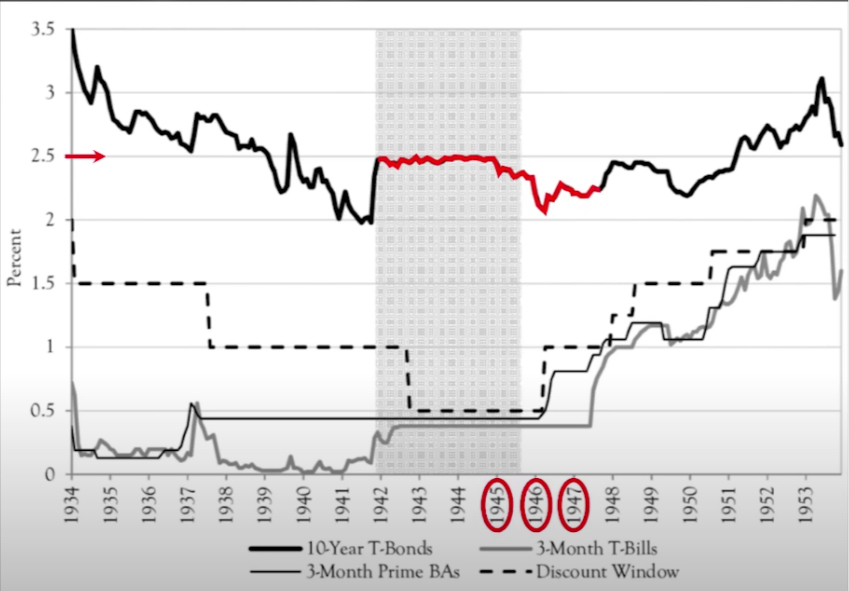
The 10-year Treasury yield (indicated by the red line) kind of flatlined around 2.5%, which makes sense. We had yield curve control, and the central planners didn't want the 10-year Treasury yield to get above that 2.5%.
The 10-year Treasury yield is the rate of return on the U.S. government's 10-year interest-bearing debt securities. It is used as a benchmark for other investments and a measure of market sentiment, indicating investors' expectations of future economic conditions. The yield changes daily in response to economic news, monetary policy, and other developments.
Generally, higher yields indicate greater risk and lower expected returns, while lower yields indicate less risk and higher expected returns. The 10-year Treasury yield is a key indicator of the U.S. economy's health, as it reflects investors' expectations for economic growth and inflation in the coming years.
But you'll notice during, say, 1945, 1946, and 1947, it actually went below the target of the Federal Reserve and the government. It's rather interesting when you think that one through. But let's go over CPI, this is really going to blow your mind.
Consumer Price Inflation (CPI)
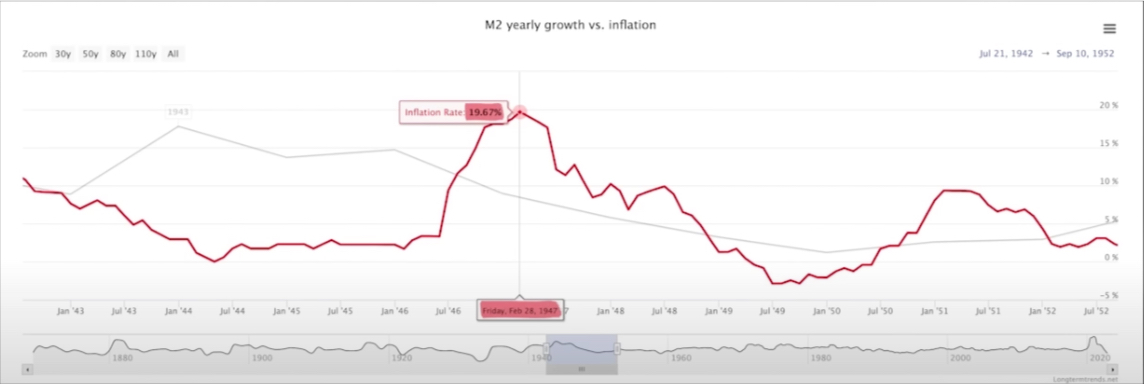
In 1947, CPI was up a little over 19%. And then CPI plummeted over the next two years to -2%.
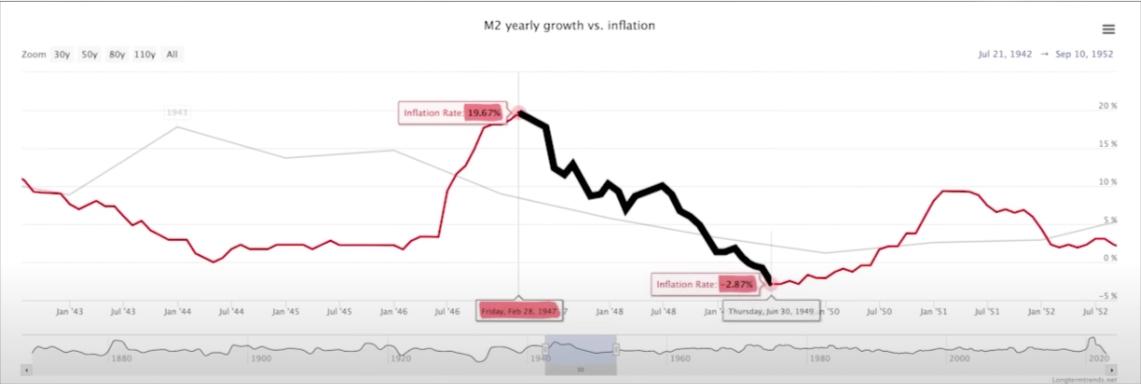
In other words, we went from high inflation to disinflation, then finally -2% deflation. And I'd like to point out that this was during a timeframe when the Feds discount rate was at a max of 2%.
During this timeframe, we had negative real rates of 17%. And we still went from 19% inflation down to 2% deflation.
This proves, beyond a shadow of a doubt, that we do not need positive real rates to have disinflation, if not outright deflation.
But I think once the CPI comes down to, let's say, 3%, or 2% because we have a significant if not severe recession, then the central planners are going to go ahead and drop rates. Then the government will come in with a Cares Act 2.0.
This time, it's likely going to be $10 trillion, compared to the $5 trillion bazooka we had in 2020. And this is what takes us to that next wave of consumer prices going up.
And they could add jet fuel to the inflationary fire by throwing in a central bank digital currency (CBDC). More on that in just a moment.
I know right about now I'm going to get a lot of pushback, and people are gonna say, “George, you can't compare the 1940s with what just happened in 2020, 2021, and 2022. I mean, goodness gracious M2 money supply in 2020, alone, went up by 25%.”
M2 money supply is a measure of the total amount of money in circulation within an economy. It includes all cash and cash equivalents, as well as other types of deposits such as short-term time deposits and certain forms of assets that are easily convertible into cash.
In the United States, M2 money supply measures M1 plus non-institutional money market funds, certain overnight repurchase agreements, and Eurodollars held within the US.
This measure of money supply is closely watched by central banks as it is seen as an indicator of economic activity in an economy.
A change in M2 affects interest rates, lending practices and investment behaviors, which can ultimately influence economic growth and inflation in an economy.
And you've got a very good point. But let's go back to 1940. Let's call it 1946 or so, just before we saw this huge spike in inflation.
And I'd like to remind you that M2 money supply during this timeframe went up by 125%.
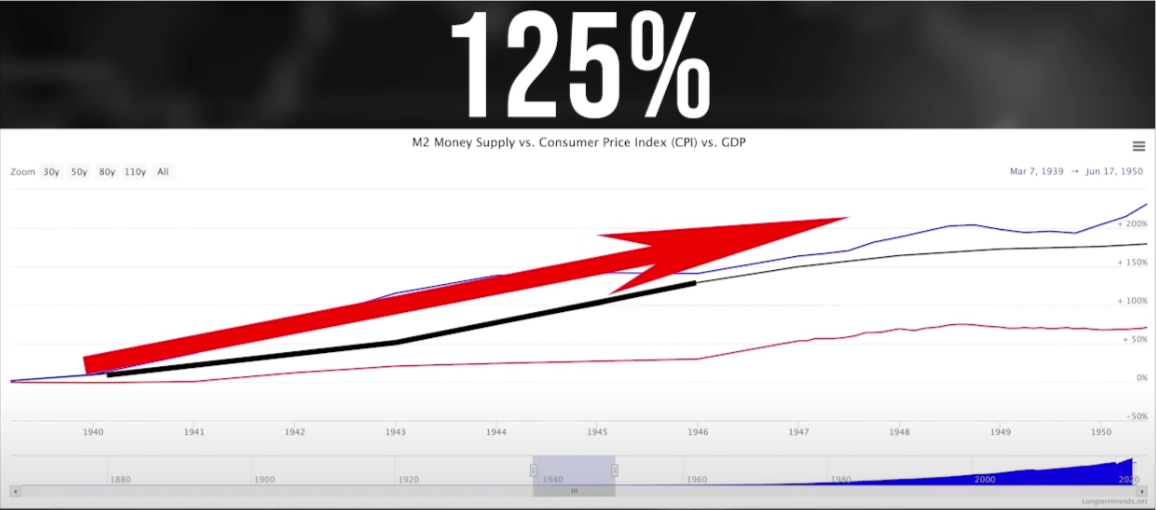
inflation increased by 125% between 1940-1945.
How do the 1940s compare to today?
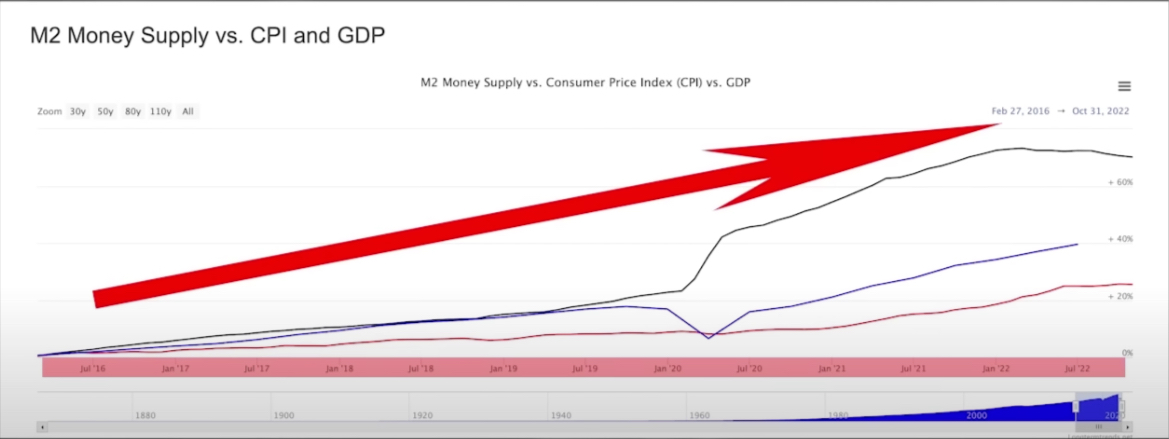
In the last five or six years, M2 money supply went up by 70%. My point is if we can see this dramatic disinflation in the 1940s, we can definitely see it in 2023.
Michael Burry 2023 Predictions
And I'm not the only one that shares this opinion. See one of the latest tweets from Michael Burry.
Inflation peaked. But it is not the last peak of this cycle. We are likely to see CPI lower, possibly negative in 2H 2023, and the US in recession by any definition. Fed will cut and government will stimulate. And we will have another inflation spike. It's not hard.
— Cassandra B.C. (@michaeljburry) January 2, 2023
“Inflation peaked. But it is not the last peak of the cycle. We are likely to see CPI lower, possibly negative in the second half of 2023. And the US in recession by any definition. The Fed will cut and government will stimulate. And we will have another inflation spike. It's not hard to figure out.” – Michael Burry
Michael J. Burry is an American investor, hedge fund manager, and physician. He rose to fame after being featured in the 2015 movie The Big Short for correctly predicting the subprime mortgage crisis of 2008.
There you have it. Michael Burry is obviously watching my whiteboard videos and ripping off my ideas and coming to the exact same conclusion. That is, in 2023, we'll have some disinflation, and most likely another wave of inflation. And, by the way, Michael, I'm just joking with you.
My Fringe Economic Predictions for 2023
Now, let's get into my fringe economic predictions for 2023. And keep in mind in step number three, and we're going to cover my outrageous 2023 economic predictions. But before we get there, let's talk about everyone's favorite subject, the housing market.
2023 Housing Market Bust
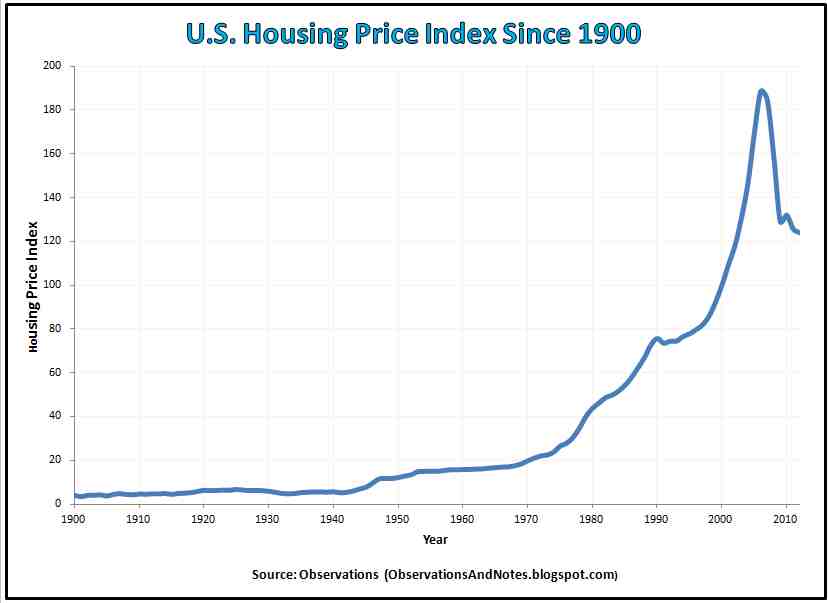
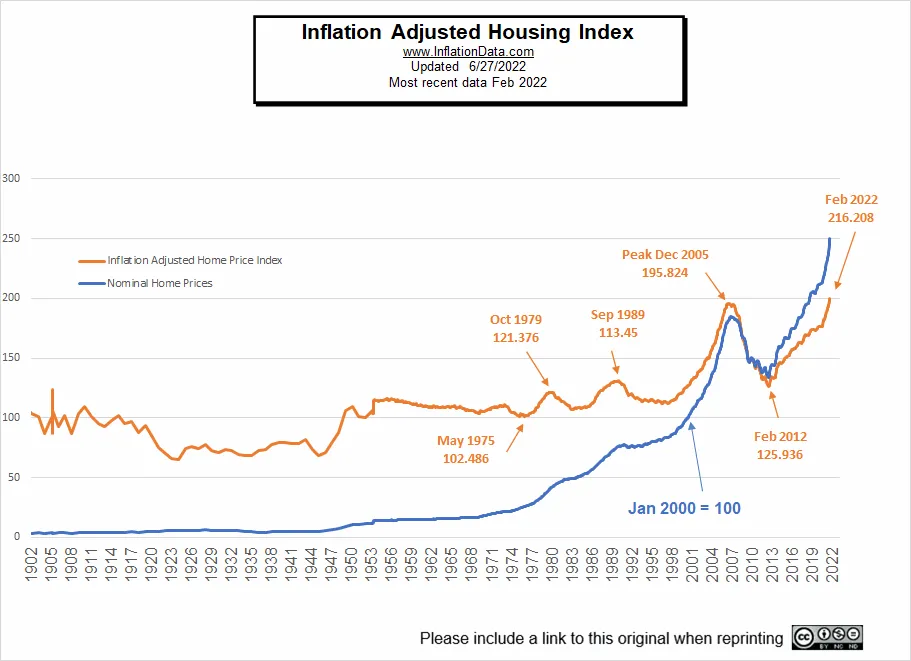
You guys know, from watching my videos, that I typically use a chart adjusted for inflation of home prices in the United States going all the way back to 1900.
The other day, I got a very good question.
This person asked, “George, if the government understates the inflation rate, meaning that the government is saying we have 7% inflation, but really it's 15% inflation, maybe even 20% inflation, wouldn't that bring down real prices to a more manageable level, where maybe we're not in a bubble?
This is a fantastic point. My answer to this person was, well, you not only have to adjust for the correct rate of inflation on housing, but you also have to do it on incomes. So let's look at a chart of not home prices, but price-to-income ratios, right here in the United States.
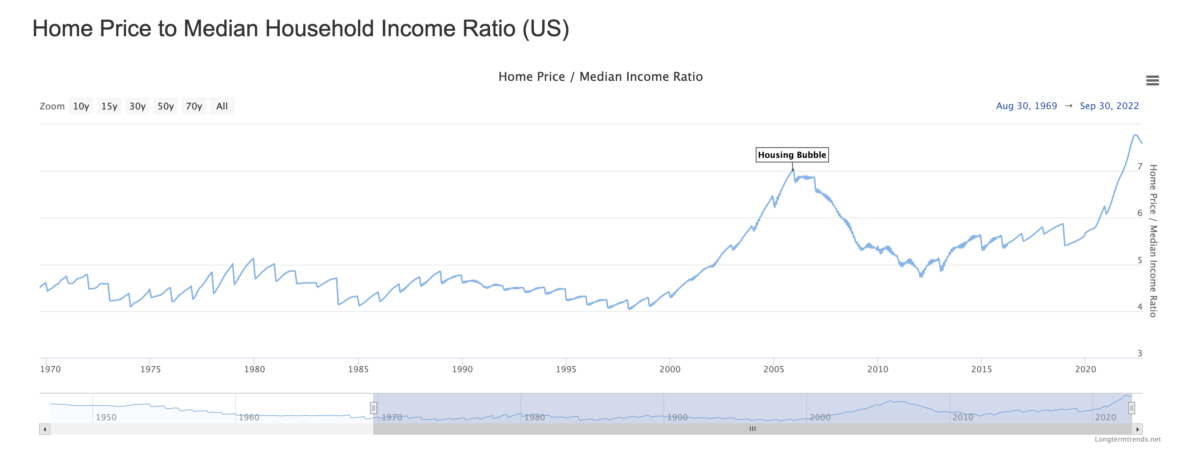
This is the average income for an American versus the average price of a home.
On the y-axis, we go from three all the way up to seven. Once we get up to seven, this means an average home price is seven times the average income.
Going back to 1970, we start off a little below five, and the ratio is represented by that blue line. It's kind of wavy, but it still stays below five. We get down to about four, just prior to the dot-com bust.
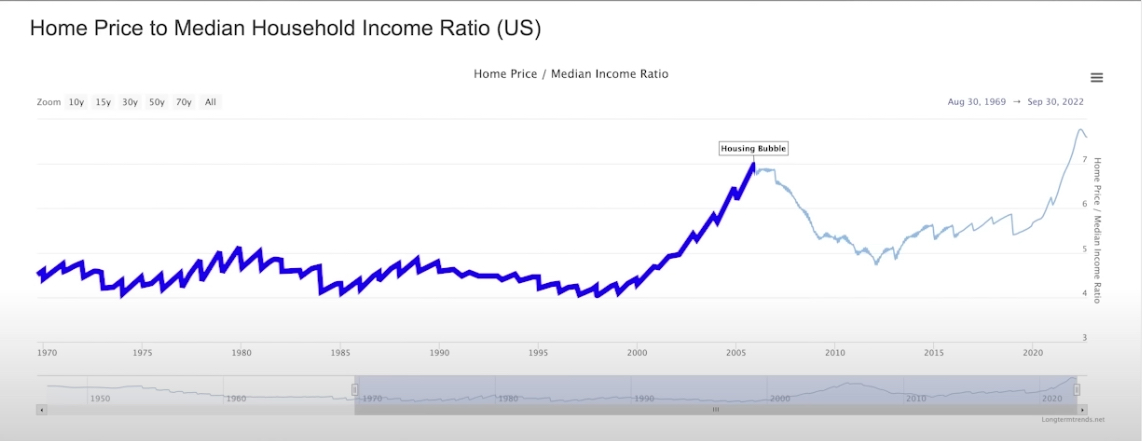
Then it goes parabolic, and we peak out around seven before the real estate market crashes in 2008-2009. It then comes all the way down to a much more healthy level.
Notice what has happened to home prices since 2012.
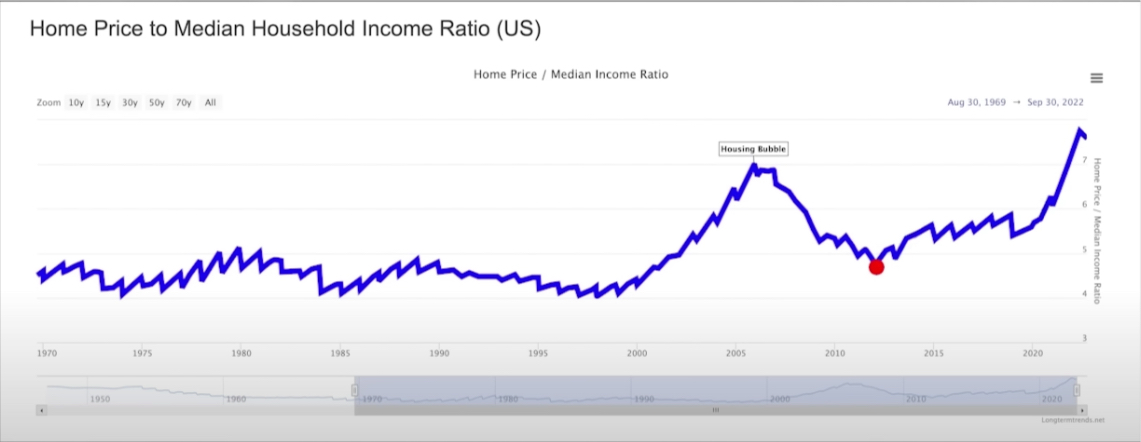
We've gone up even higher than we were in 2006 or 2005, at the peak of the last housing bubble. And I also want to point out that home prices and the price-to-income ratio have already started to roll over.
In my opinion, it's going to continue going down till we get to a point right around where we were in 2012, going back historically to a level that's far healthier, under five.
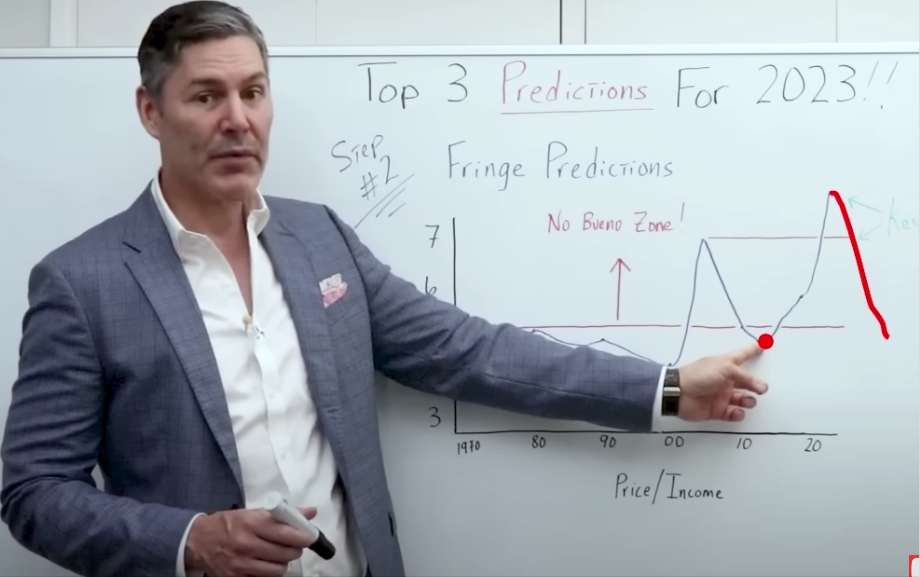
I'm not predicting that home prices fall all the way down to 2012 levels in 2023 alone.
What I am predicting is that home prices adjusted for inflation will be lower at the end of 2023 than they are today.
[ctt template=”3″ link=”49av1″ via=”no” ]What I am predicting is that home prices adjusted for inflation will be lower at the end of 2023 than they are today.[/ctt]
And another question I get all the time is, “George, well, we know that you think the housing market is incredibly expensive right now, when would you step back in and start buying real estate? Because we know that's one of your favorite investments.”
The answer is when prices get out of the infamous No Bueno zone. Anything above five, and I don't like it, anything below five, and I start to get interested.
Now I'm going to give you a couple of free bonus predictions that are in the group of 2023 fringe economic predictions. Now let's talk about gold and Bitcoin.
Gold and Bitcoin in 2023
I think both gold and bitcoin will actually be higher in 2023.
I don't think Gold and Bitcoin go up in a straight line. But I do think they'll most likely roller coaster ride their way up. I think they will end 2023 at a higher price than when they started in 2023.
[ctt template=”3″ link=”qfwW4″ via=”no” ]I don't think Gold and Bitcoin go up in a straight line. But I do think they'll most likely roller coaster ride their way up. I think they will end 2023 at a higher price than when they started in 2023.[/ctt]
My Outrageous Predictions For 2023
The moment you've all been waiting for, my outrageous economic predictions for 2023. And, of course, I've got to start with a black swan event.
A black swan event is an unforeseen and unpredictable event that has severe consequences. It often carries a high degree of surprise and shock, as well as potentially catastrophic effects. Black swan events are usually characterized by their extreme rarity, huge impact, and retrospective (though not prospective) predictability.
And I hate to go over these things. But unfortunately, that's the reality of the world we live in right now.
Bonus Blackswan Event Prediction – Serious Social Unrest Due To “The Medicine” Being Declared Unsafe By The Media
I think one of these black swan events could be that the covid vaccines turn out to be unsafe, and the media actually picks up this narrative. I don't know that they would. But assuming they do, then all the people that put their faith and trust in the government and its institutions, all of a sudden lose trust. This could lead to some serious social unrest.
Bonus Black Swan Prediction #2 – The War with Russia Escalates
And, of course, going into 2023, we can't eliminate the possibility of, let's say, engaging with Russia. And I don't like to talk about that one either. But I don't want to bury my head in the sand as well.
Assuming that we have some sort of black swan event in 2023, these two are at the top of the list for me.
Outrageous Economic Prediction #1 – Negative Interest Rates
If we get some significant deflation, as a result of going into a financial crisis, not just a recession, but maybe an economic depression, we could see negative real interest rates again.
Negative real interest rates occur when the inflation rate is higher than the nominal interest rate. This means that although you may be receiving a positive nominal return on your investments, after factoring in inflation, your actual return is negative.
For example, if you are receiving a 1% return on your investment and the inflation rate is 2%, then your real return is -1%.
Negative real interest rates can have a significant impact on the economy and financial markets. They discourage saving, as people are not rewarded for delaying consumption, and encourage borrowing, as it becomes cheaper to do so.
This would be my first outrageous economic prediction for 2023. We could see negative interest rates. That's right, we thought that was something of the past, but maybe it's something we will see in 2023.
And if we do have some severe deflation, as a result of an economic recession, or even a depression, and we get these negative rates, I think the Federal Reserve will come right out with a central bank digital currency, this would be my second outrageous prediction. Maybe not that outrageous, unfortunately, for 2023.
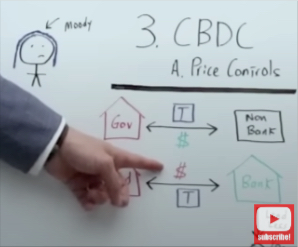
Outrageous Economic Prediction #2 – Central Bank Digital Currency (CBDC)
Remember, deflation first, then inflation. If we do get severe inflation, during the next wave up, then I think they could try to cap it by using price controls.
Price controls are a form of economic regulation, typically imposed by governments, which place a limit on the price at which certain goods and services may be traded. It is usually done to prevent inflation from spiraling out of control.
Price controls are ultimately detrimental to the economy as they fail to take into consideration the true costs of production and do not incentivize producers to innovate or increase efficiency.
Price controls also disrupt the normal market forces of supply and demand, which can lead to shortages in goods, higher unemployment rates, and an overall decrease in economic growth.
But let's go back to the central bank digital currency. Because this is something that I think needs explaining.
A lot of people have heard of a central bank digital currency, but they don't really know how it would work.
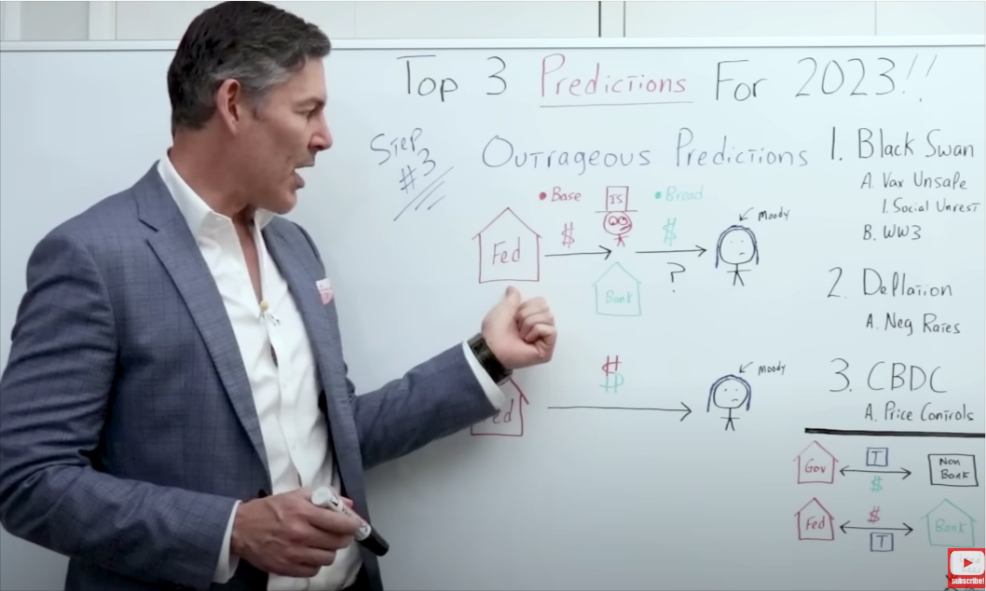
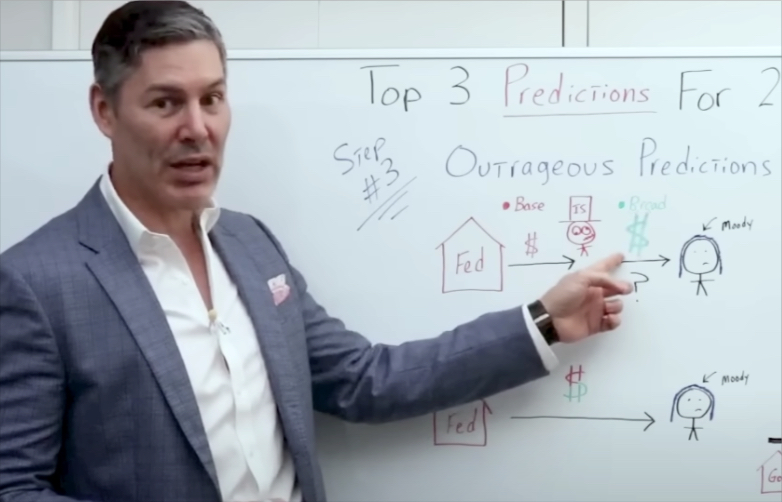
Let's start with the Federal Reserve on the left in between the Federal Reserve, and everyone's favorite, Moody The Millennial, we've got your Drunk Insolvent Uncle Sam, ie the government, and we have the banks and the banksters themselves.
Notice that the dollar sign that I have going from the Federal Reserve to the government or the banks is in red.
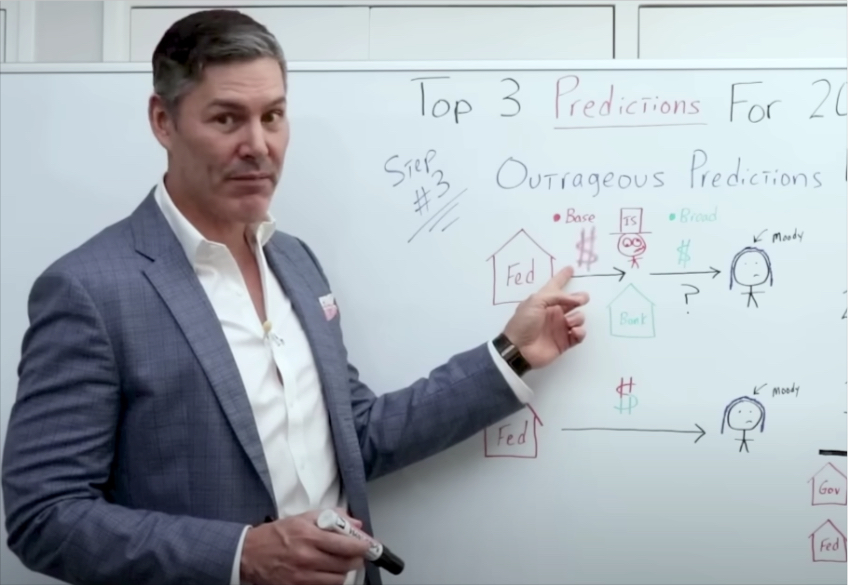
And the dollar sign that I have coming out on the other side is green. What am I trying to represent?
Well, I'm saying that this red dollar sign is really what we should consider base money, or M0 money supply if you want to get technical.
M0 money supply, also known as “base money,” is the total amount of physical currency and coin circulating in an economy. This includes all coins and paper notes in circulation (banknotes and coins) that are either held by the public or are in the hands of commercial banks.
M0 money supply does not include other forms of money such as demand deposits, savings accounts, and other forms of near-money; these are usually categorized as M1 or M2 money supply.
M0 money supply is used in monetary policy by central banks to influence inflation, unemployment, and economic growth.
Central banks can increase or decrease the amount of money in circulation through open market operations or changes in reserve requirements.
An increase in M0 money supply can lead to increased spending and lower interest rates, while a decrease in M0 money supply can lead to reduced spending and higher interest rates.
Central banks typically use the M2 money supply measure more often than M0 when making monetary policy decisions.
This green dollar sign is really broad money or M2 Money Supply.
I want to distinguish between the two because this is what we should focus on when thinking about deflation and inflation.
M2 Money Supply represents the number of dollars or currency units that are in the real economy chasing goods and services.
If we run into a black swan event in 2023, and the Fed tries to fight deflation, by increasing the currency units that are chasing goods and services, then they will run into a brick wall.
Now, you can say that the government can spend, and the Fed can monetize the debt. But that isn't necessarily a surefire way to create the consumer price inflation that they would want if they're actually (believe it or not) trying to fight deflation.
Let me give you a quick example of what I'm talking about.
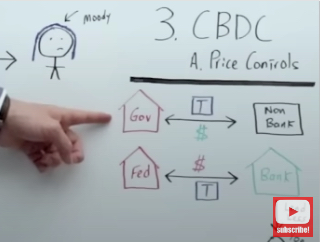
We've got the government, the Treasury, and Janet Yellen herself knowing that they need to, quote-unquote, stimulate the economy to get out of this horrible deflation. What will they do?
They're going to deficit spend like the drunken sailors they are. They're going to issue a heck of a lot of treasuries.
Now, let's assume for a moment that the only entity that shows up to buy these treasuries from the government is a nonbank entity in the real economy.
A nonbank entity is any organization or individual that carries out financial activities but does not hold a banking charter.
This could include private lenders, hedge funds, insurance companies, investment banks and other types of financial services providers.
Nonbank entities often provide credit and loans to individuals or businesses that may be unable to access these services through traditional banks.
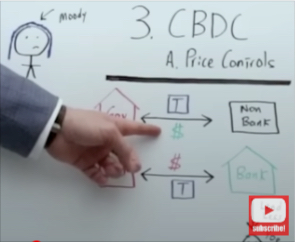
If a nonbank entity is buying treasuries directly from the government, they're going to use a green dollar sign. They're going to use M2 money/broad money.
Let's assume for a moment that the Fed comes along and starts quantitative easing once again. But the Fed can't really choose who they buy those treasuries from, it's really kind of up to the sellers, who want to sell.
Quantitative easing (QE) is a monetary policy used by the Federal Reserve to stimulate economic growth. It involves the purchase of government securities or other financial assets from banks and nonbank entities in order to increase their liquidity and encourage investment, thereby boosting economic activity. The Fed can also use QE to lower interest rates and make it easier for businesses and consumers to borrow money, which can help stimulate economic activity.
If nonbank entities are buying treasuries, then most likely, one of the only sellers would be the banks themselves.
If the Fed is buying treasuries from banks, instead of nonbank entities, then they're using base money (M0 money supply). These are not greenbacks like we are used to, but dollar-equivalent bank reserves that never see the real economy.
They're using the red dollar sign, instead of the green dollar sign. And this is crucial to understand.
In this first transaction, M2 money supply is decreasing because dollars (like we are used to) are coming out of the account of a nonbank entity.
When Janet Yellen spins dollars back into the economy, dollars are increased by the same amount that they were initially decreased. So on net balance, there is no difference.
If the Federal Reserve comes in and buys directly from a bank using dollar-equivalent bank reserves (red dollar sign), then it doesn't impact M2 money supply or broad money.
Remember, M2 Money supply is the number of currency units in the real economy, chasing goods and services.
And let's not forget, during extreme economic turbulence, even if we do have very low rates, like negative rates, it doesn't necessarily mean the banks are going to be lending.
Cheap Money Doesn't Mean Loose Money
In fact, in this environment, although money maybe even less than free, it's going to be extremely tight. Borrowing is going to seize up.
Therefore, you have the government doing all this deficit spending, the Fed doing quantitative easing, quote-unquote, monetizing the debt.
We also have banks decreasing the amount of lending, which means only the outstanding loans are being paid back, and currency units are not being lent into existence.
You can see that in this very simple example, the number of currency units or M2 money supply would actually decrease significantly, even when the Fed was, quote-unquote, monetizing the debt.
How could the Central Planners and the Authoritarians get around a significantly decreasing M2 Money Supply?
Central Planners would need to eliminate your drunk insolvent Uncle Sam, and the banking system and transfer currency units directly from the Federal Reserve to Moody The Millennial. They'll do this with a central bank digital currency.
Moody will simply take “their” cell phone and download the Fed app. In doing so, they'll have an account at the Federal Reserve. The Federal Reserve can put bank reserves or base money (M0 money supply) into Moody's account, and moody can spend the base money just like they can spend broad money (M2 money supply) right now.
So my outrageous economic predictions for 2023 are negative interest rates, price controls, and a central bank digital currency.
Comments are closed.