The Current State of the Stock Market
We've got unemployment going through the roof, defaults going through the roof, the cerveza sickness, riots, looting, and social unrest. But the stock market continues to go up and up and up.
Will this last forever?
The short answer is no. And I'm going to explain this to you in three simple, fast steps.

The S&P 500, and inflation
Why does the stock market keep moving up during an economic crisis?
We all know the bullish argument for the stock market or why it will continue to go up. The Fed's balance sheet going through the roof. Their balance sheet is going to 7 trillion and higher.
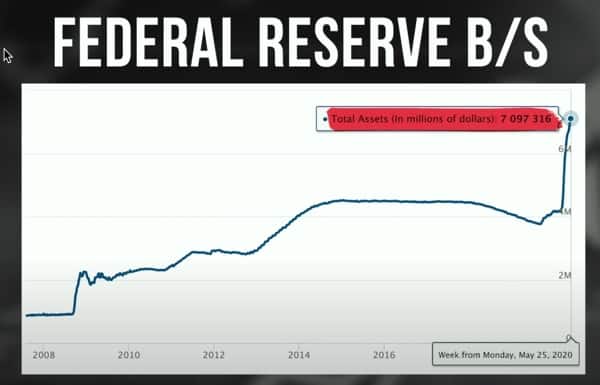
They're printing up all this funny money, capital flows coming in from Japan and Europe, and all of these other areas that see the United States and the stock market as the cleanest dirty shirt in the hamper.
Plus, we've at least got zero-rate-interest policy (ZIRP) here, which, I guess you could say they're positive, at least a lot more positive than Europe in Japan.
And of course, we've got the reserve currency; the safe haven of the United States dollar.
But there's also another factor the stock market could go up, that nobody is talking about.
So put your thinking cap on, let's dive right in.
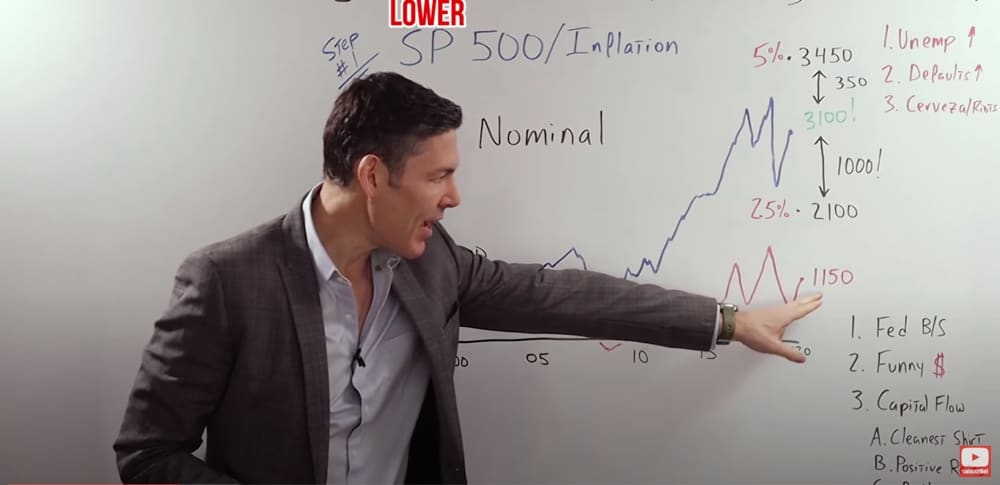
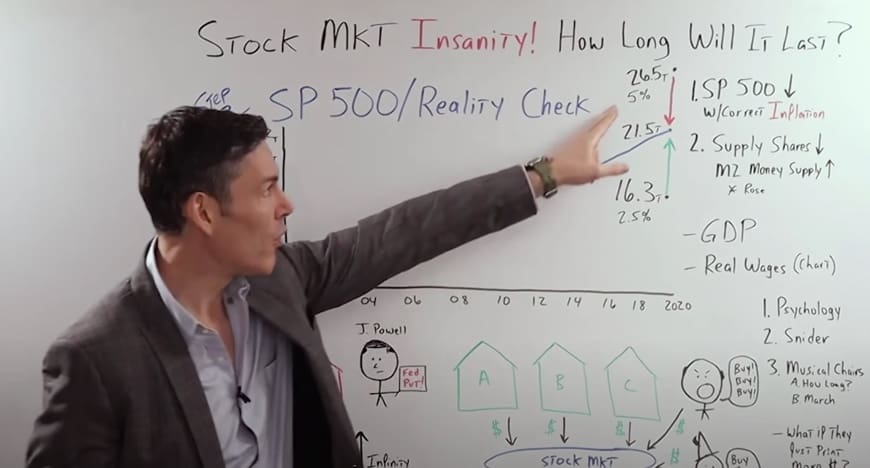
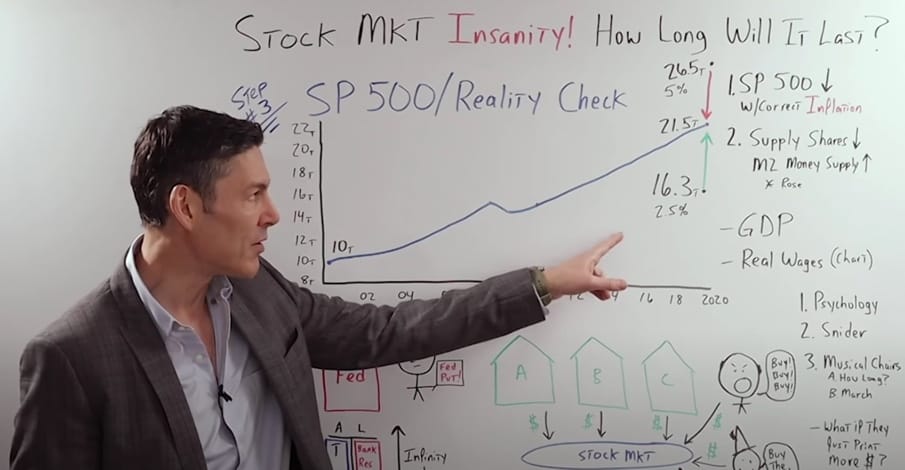
We've got a chart of the S&P 500. Nominal; it's not adjusted for inflation yet. Going back to 2000, all the way to 2020.
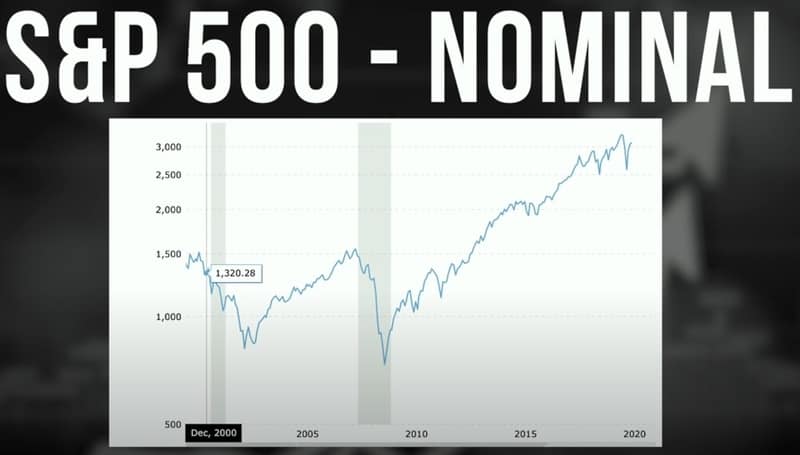
On the left goes from 500 up to 3000. 2000; the year 2000, we start the S&P about 1300. Today, well it's around 3,100. Who knows where it is right now?
I haven't checked today. It could be up another 100 points, who knows. If we get enough bad news, I'm sure it's up 200 points. But the bottom line, it's right around 3,100. But what happens if we adjust for a rate of inflation?
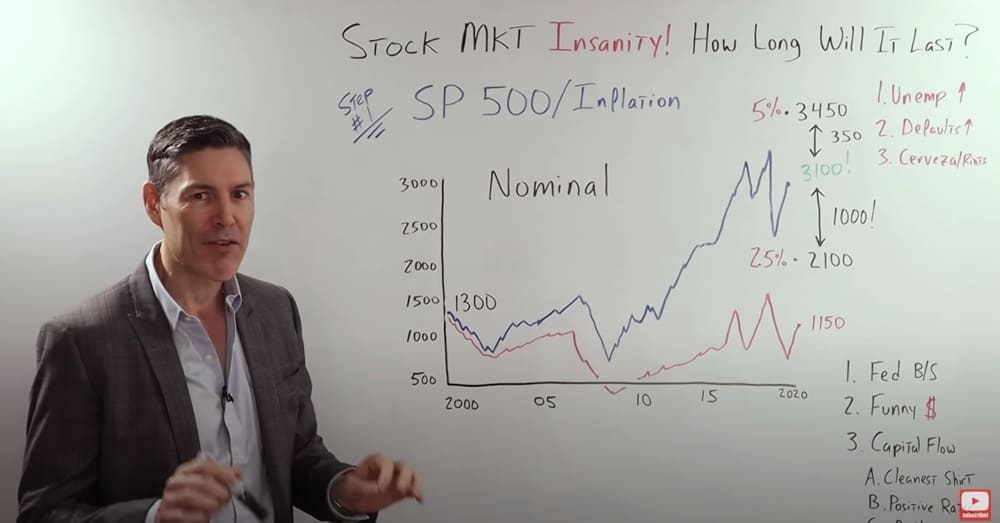
As you and I know, the government won't admit to anything more than 2.5% on the CPI, the consumer price index inflation.
So let's say on average, since 2000, the inflation rate has been 2.5%. For us to have a break-even, for the S&P to be at the same levels, adjusted for inflation in 2020 as it was in 2000, today, it would have to be at 2100.
Well, we're at 3,100, so that's great. You've had a good size gain in real terms.
Not so fast.
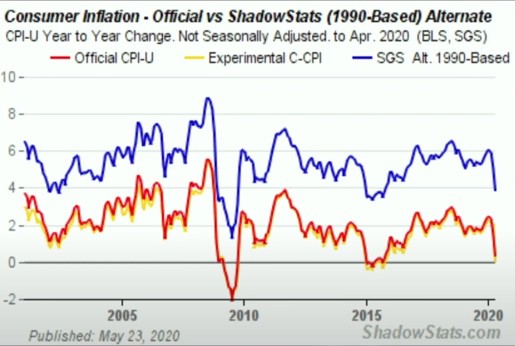
Most of us believe, me included, that we've had a lot higher inflation than 2.5% since the year 2000, especially when you look at shadows stats and you see the numbers if they were calculated the same way they were by the government in the 1970s, 80s, and 90s.
But let's say the real rate of inflation has been 5%.
That means that since the year, 2000, in order for the S&P to be at a break-even, adjusted for inflation, it would need to be at 3450, but that's a lot higher than 3,100.
In other words, if we adjust for a 5% rate of inflation, the stock market would actually be lower today than it was in 2000.
So maybe, what we can conclude right now, is the stock market is actually cheap.
And I know you're saying, “George, have you lost your mind? It's not cheap at all.” I know, I know, I know.
When we get to step number three, I'm going to show you why it's not cheap, but I wanted to present this to you because it's something that nobody's talking about.
Even the pros, I don't think have thought this through. So I wanted to give you this information. So you can start thinking outside the box.
And you may be saying to yourself, “George, wouldn't that also apply to that chart that you used of housing adjusted for inflation going all the way back to 1900?”
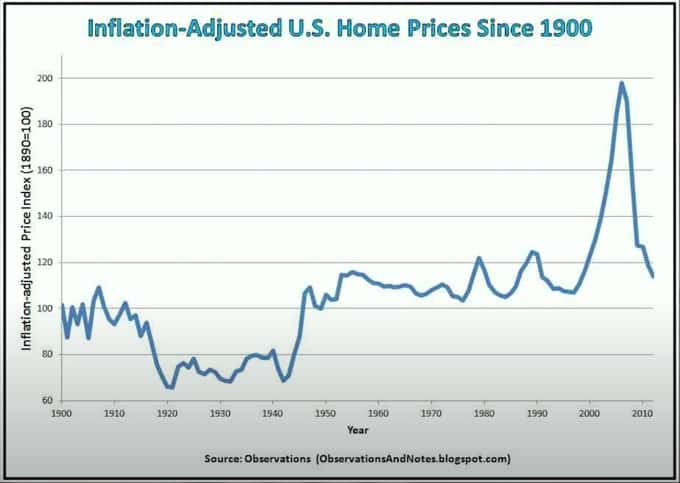
Yes, it would; that is very perceptive of you. But does that mean that home prices right now are super cheap and you should run out and buy one?
Because, oh my gosh, if we adjusted for the correct rate of inflation, then we wouldn't be in a housing bubble, just like we're not in an S&P bubble right now.
Not so fast. Again, let's wait for step number three.
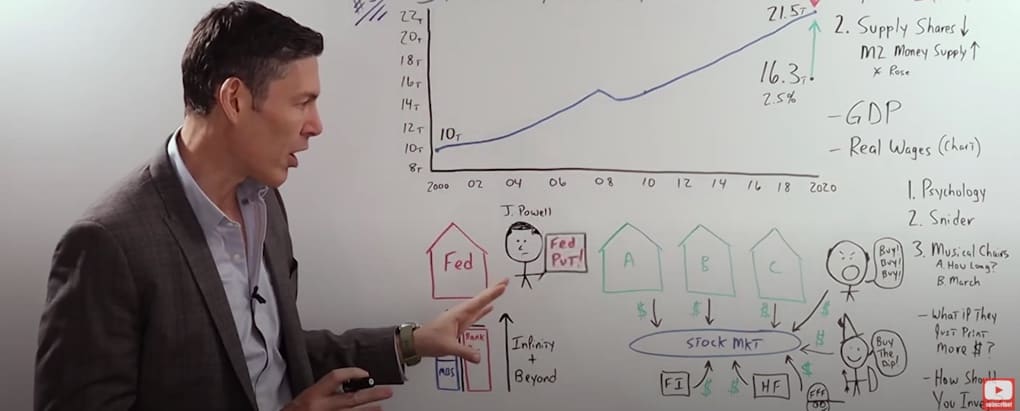
the S&P 500 number of shares outstanding vs the M2 Money Supply.
So in step number one, we got outside of the box by understanding that the S&P 500 in real terms would be a lot lower if we adjusted for the correct rate of inflation.
But now let's get even further outside the box to try to explain why the market has continued to go up regardless of the fundamentals.
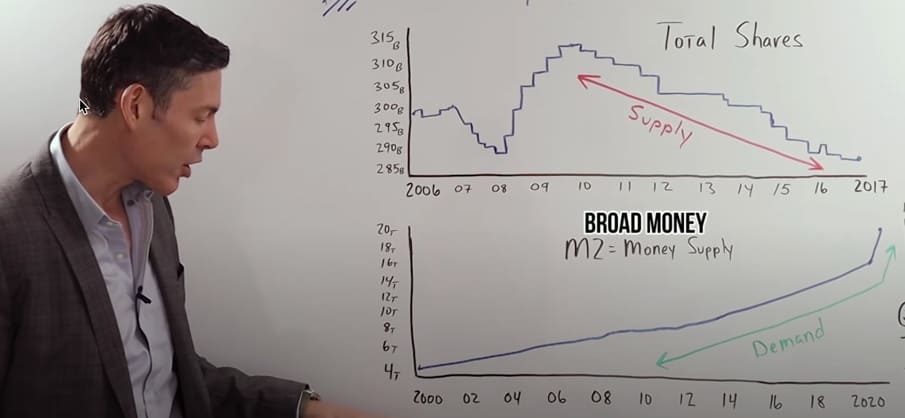
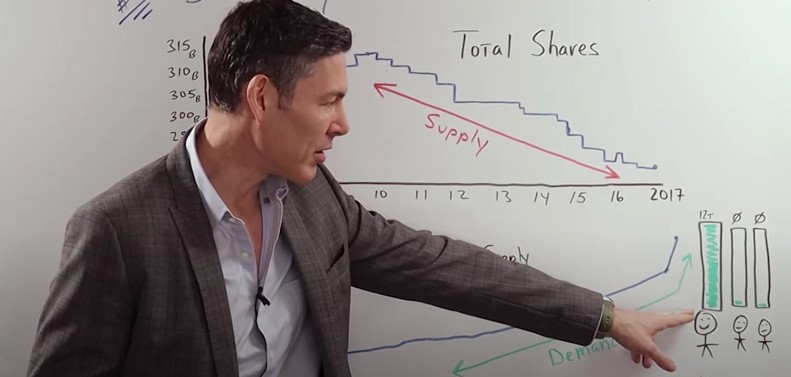
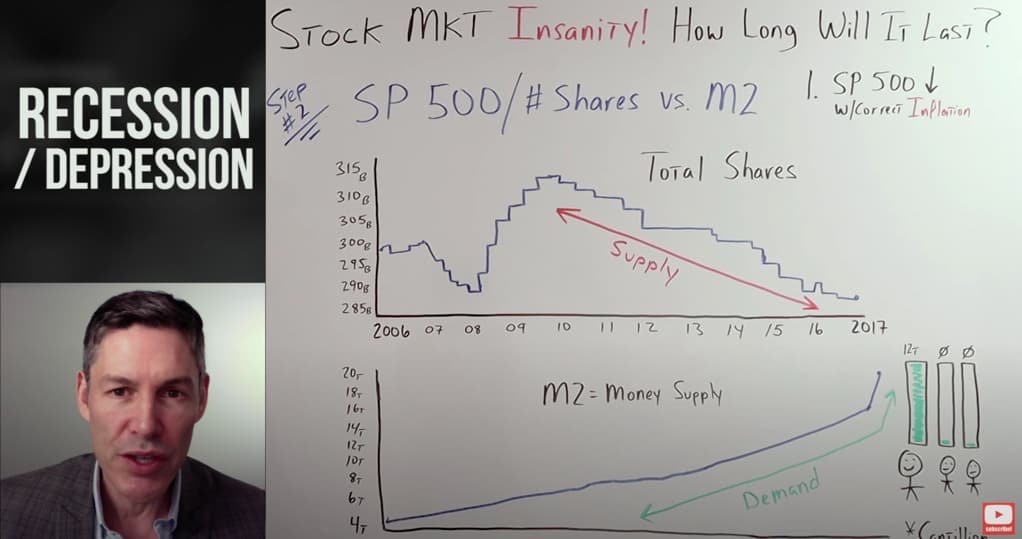
And then again, we're going to connect all the dots in step number three, we've got a chart of total shares, outstanding in the S&P 500, going back to 2006, all the way to 2017.
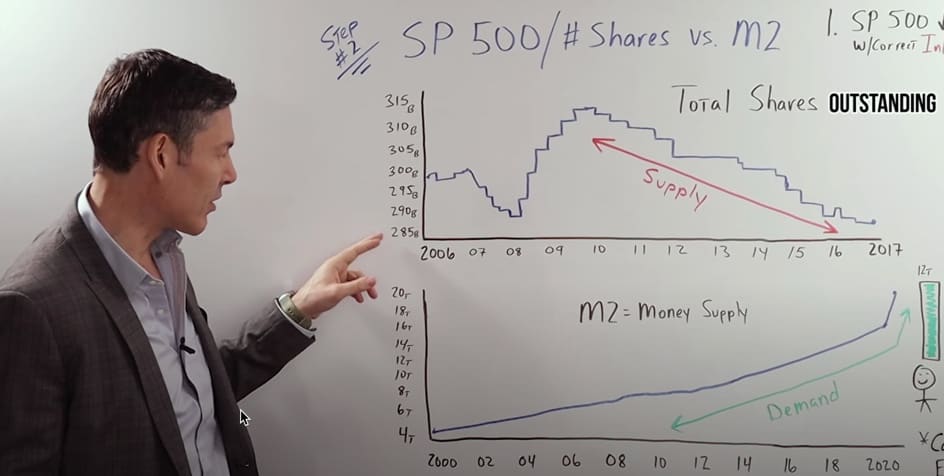
And these are the number of shares in billions; on the left, 285, up to 315.
So you can see right around the GFC, and I think this is very interesting, that as the corporations got into more financial difficulties, they sold more shares.
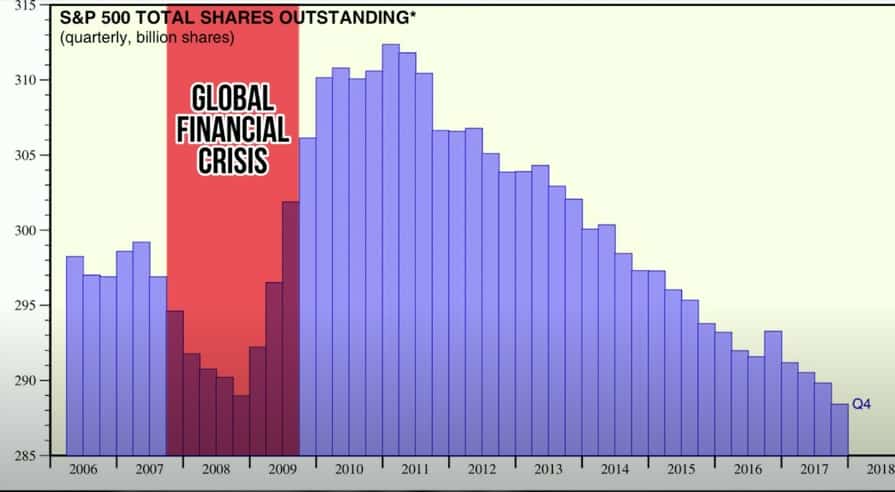
This makes sense to generate working capital they need to weather the storm.
But in 2010, once the Fed came in with quantitative easing and the so-called Fed put, they continued to buy back all of those shares. So the supply actually went down and down and down, all the way to 2017. My guess is today, it would even be lower.
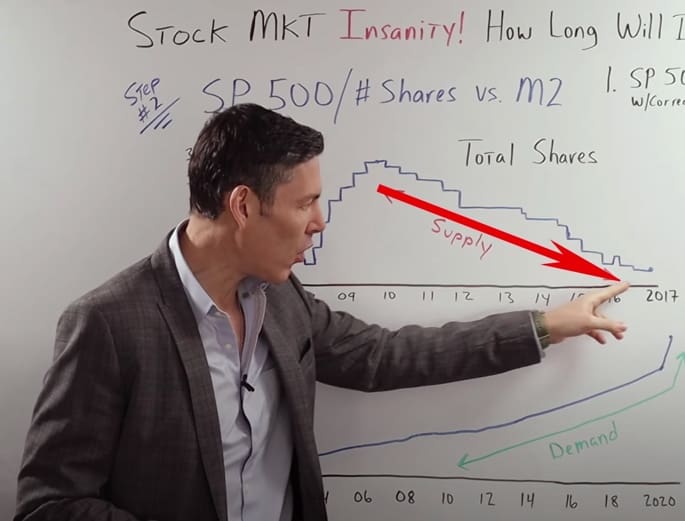
But the big takeaway from this chart is this supply of shares, the available shares to buy has continually gone down since 2010.
Let's juxtapose this to the M2 Money Supply, which is a measurement of broad money in the economy, not bank reserves, which is based money held at the Fed.
Again, broad money in the economy. So this is how much money the commercial banks and retail banks have actually created against the bank reserves they have at the Fed.
But again, that's a whole other video here; this is broad money.
So our chart goes back to 2000 all the way to 2020. And you can see, it pretty much just goes up and up and up.
On the left, we start at 4 trillion, goes all the way up to 20 trillion.
So in 2000, broad money was about 4 trillion, it went up just gradually to the point where we got to 2020 around 16 trillion.
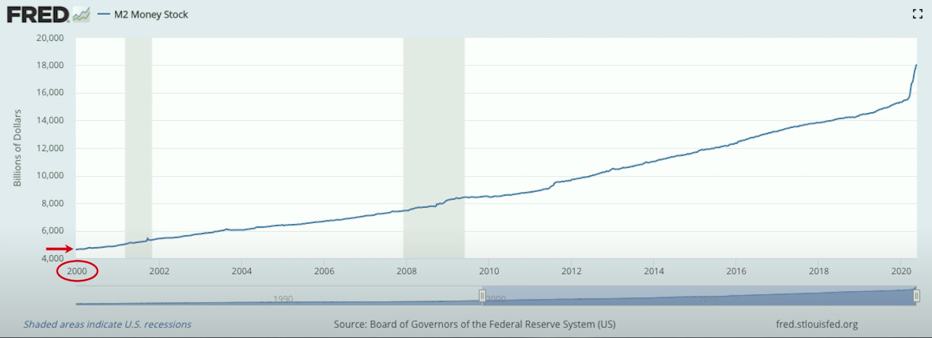
And you know what's happened recently, the Fed has taken their balance sheet to infinity and beyond. And although there's not direct causation, in this case, there was definitely a correlation.
Because we can see the M2 Money Supply also has gone parabolic.
So the potential supply has gone down, but the potential demand has definitely increased.
So this could be another outside of the box reason that stocks have gone up and maybe even a bullish argument for stocks continuing to go up in the future.
But of course, we haven't got to step number three yet.
The Cantillon Effect: Why Banksters And Wall Street Get a Bailout and You Don't
 And one thing I'd like to point out is the Cantillon Effect. When we look at all this money supply that's being created, we know that it's not being dispersed equally.
It's going to the cronies, the people who are closest to the fed and the government spending.
Their M2 Money Supply could have gone up by 12 trillion, while everybody else in the population, their checking accounts have gone up by zero.
The Cantillon Effect is one of the main reasons I think you're seeing so much social unrest in the United States today.
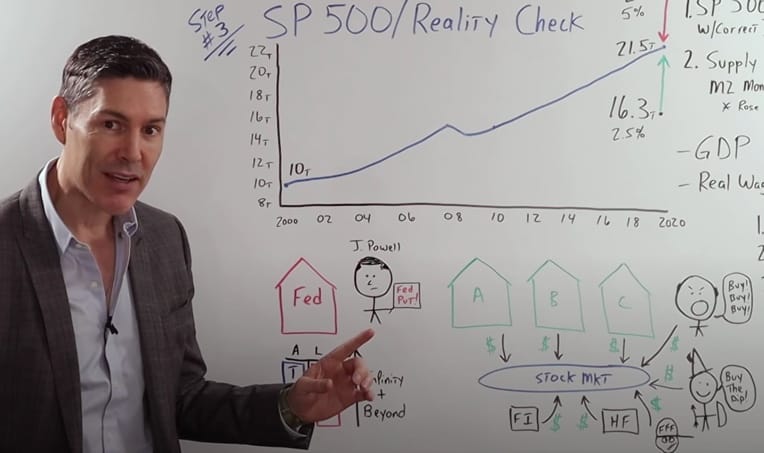
the S&P 500 reality check
We learned or at least rose-colored glasses George taught you hopefully, to get outside the box, start thinking about things in a different way.
And we learned how the S&P 500 with the correct amount of inflation, goes down. The supply of shares in the S&P has gone down, money supply has gone up.
And again, with rose-colored glasses George, maybe he's a new character on the YouTube channel. But he showed you how there could be an argument for stocks to go higher.
But, what rose-colored glasses George didn't show you, was this chart.
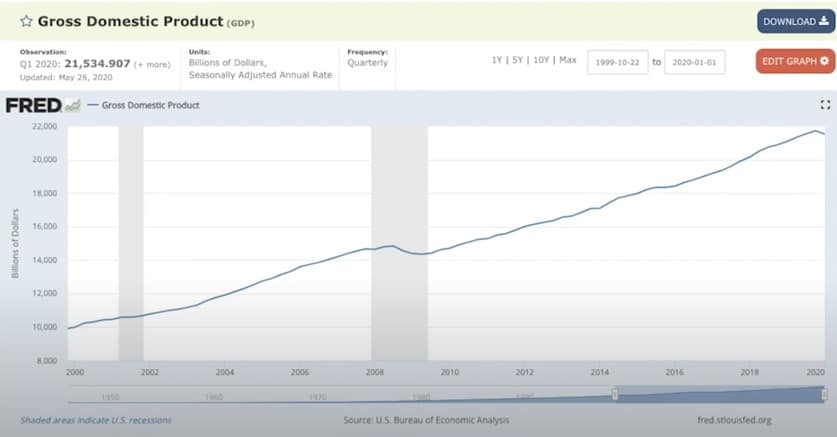
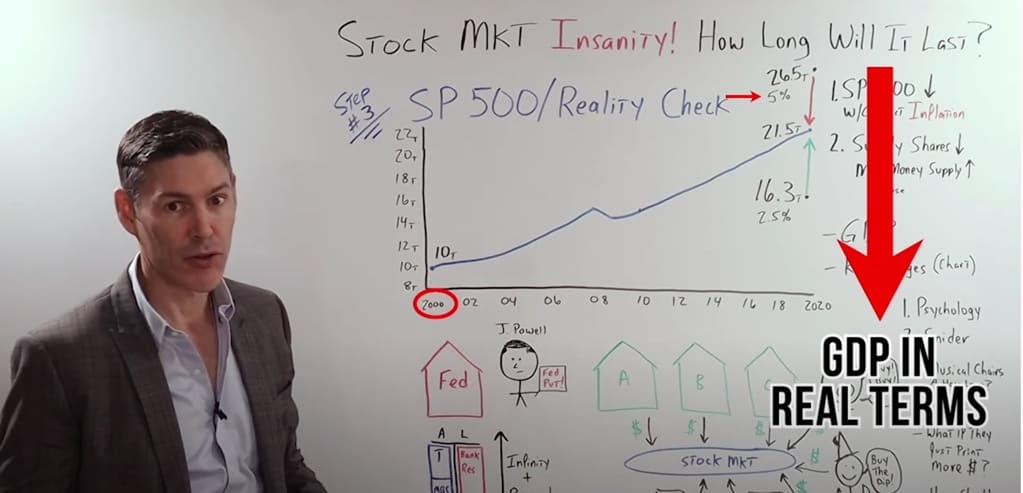
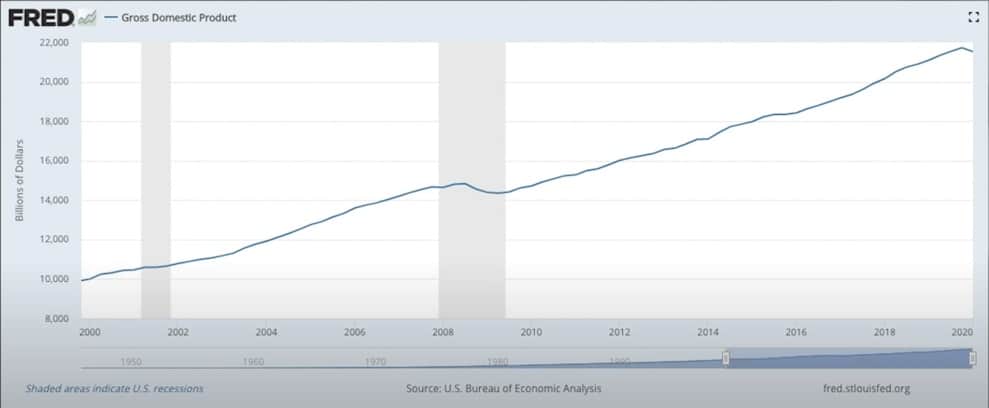
This is a chart of Nominal GDP, going back to 2000, all the way to 2020.
On the left, it goes from 8 trillion up to 22 trillion.
In 2000, it's right at 10 trillion, in 2020, we're up close to 21.5 trillion.
But again, remember, this is not adjusted for inflation.
So what if we adjust for the exact same numbers we used in step number one?
If we had an average inflation rate of 2.5%, the GDP today would need to be 16.3 trillion to be at the same level in real terms, as it was in 2000. But if the real rate of inflation was 5%, then GDP would have to be 26.5 trillion.
So you can see if the rate of inflation was 5%.
GDP in real terms has actually gone down since the year 2000. This could explain why the S&P 500 would have gone down using the same measurements. And why the housing market might not have gone up as much as we thought since 2012.
I'd also like to point out that if the inflation rate was actually 5% and GDP has gone down since the year 2000, that means we have been in a recession, if not a depression for the last 20 years, at least the last 10 years.
And you say, “Well, George, that can't be right, or else we'd see rioting in the streets. We'd see looting, we'd see all of this social unrest.”
Think about that one for a minute. I want to be clear, I'm not saying that stocks and the real estate market are cheap because they're actually a lower price when we adjust for the real rate of inflation.
I am saying they're a lower price because real GDP growth has most likely been a lot lower than we've been led to believe. But let's take it another step.
Editor, throw up a chart of real wages.
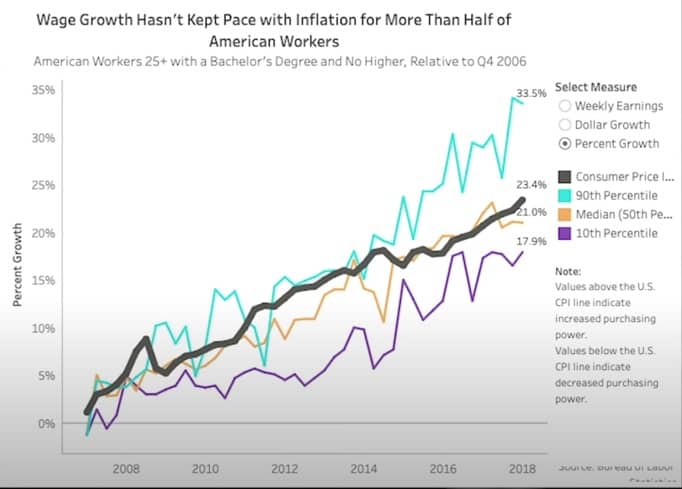
These are nominal wages for three different income groups; the top income group, the middle-income group, and the bottom income group. And in the middle of the dark black line, is the rate of inflation.
At least that's what the government is willing to admit to.
So even with the low ball CPI numbers, wages for the middle-income bracket and the lower-income bracket, have gone down in real terms since… call it 2006.
The only groups where wages that have increased in real terms are the highest wage earners.
But what if inflation isn't adjusted correctly? What if it's higher than what the CPI is suggesting?
Well, then we could say the consumer price index has gone up by, let's say 50% since 2006. And all of the income group's wages would have gone down, adjusted for inflation.
And if you look at how much the middle and lower-income groups wages would have gone down, is there any surprise whatsoever that we have rioting and social unrest.
When you layer this over real GDP being lower than it was in 2000 and the S&P being lower since 2000, when you adjust for a higher rate of inflation, it all starts to make sense.
Whoa, time out. I actually forgot to go back and address the charts from step number two.
But fortunately, my editors are amazing, so we can cut this back in during post and we won't skip a beat.
why I think this is actually bearish instead of bullish
So going back, why I think this is actually bearish instead of bullish like I explained in step number two.
When the total amount of shares went all the way down, this decreased the supply, while the money supply was going up, potentially increasing demand.
It goes back to 2008, 2009. If we go through a recession, or when we go through this recession/depression with the Cerveza Sickness, I think corporations are going to be squeezed, and they're going to be right back into a position where they need to sell equity, to generate the capital they need to survive.
 Also, I think the government is going to limit buybacks moving forward, and they're going to increase corporate taxes.
This is another reason why I think there'll be selling more shares in the future, increasing the supply instead of decreasing the supply.
And this is why I think that moving forward, this tailwind for the market that we've had over the last 10 years, will turn into a headwind.
How Long Will The Stock Market Insanity Last?
Now let's focus specifically on the question, how long will the stock market insanity actually last?
And to do this, we have to understand that a big component of the stock market going up since March, when we've had all of these fundamental reasons for it to go down, has been psychology.
It goes back to the Fed put, we're going to talk about this in just a moment. But to understand how this all works a lot better, let's go to a recent clip from Jeff Snider and Emil Kalinowski's show on YouTube, Making Sense Eurodollar University.
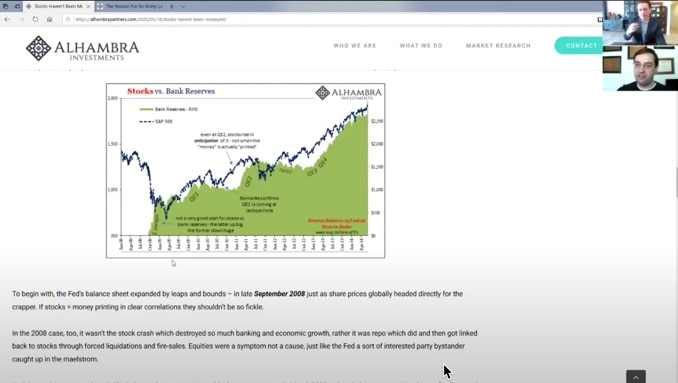 Jeff Snider – What happens is, the Fed announces QE. The Fed knows that everybody in the financial services industry believes in the Greenspan Put, believes in the myth, believes in the magic and the fairytale and the legend of the Federal Reserve.
They know that everybody in the financial services industry has been trained, don't fight the Fed.
Therefore, all they need to do is signal to most people, most portfolio managers who just, they're itching to buy anyway, because higher stock prices, more stocks, means higher fees.
That's what happens, the Fed signals to portfolio managers in the financial services industry.
They say, “Look, we're going to do a bunch of monetary stuff. Don't ask any questions. Well, you can call it money printing, if you want.”
And what happens, is it unleashes a torrent of buys across all the funds. All the portfolio managers are itching to do it anyway.
So it's Ben Bernanke back then ringing the bell, to all sorts of professional financial services managers to start buying stocks, which they do.
And I think 2010 is probably the best example of what I'm talking about, because Ben Bernanke in August of 2010, in response to what was another deflationary wave building, not just in Europe, but across the Eurodollar system, decided, “Hey, I'm going to announce in August 2010, that there'll be a second round of QE.”
Now, any normal type of environment, everybody would've said, “Wait a minute, a second round of QE?
If you have to do QE twice, maybe the first one didn't work.” But that's not what happened.
In the stock market at least while the economy retreated, in the stock market, as soon as Ben Bernanke announced, there would be a QE2 in August of 2010, shares zoomed ahead.
It was the psychology effect, and a perfect example of it, because they didn't actually start QE2, balance sheet expansion, and bank reserves until November of 2010.
And really the level of bank reserves didn't go up substantially, until early 2011.
So it's not a direct monetary correlation, it's a signal to the portfolio and fund managers to start buying because,
“Hey, don't ask any questions. We've got your back.”
So what Jeff Snider is saying is Jerome Powell comes out on 60 minutes and says,
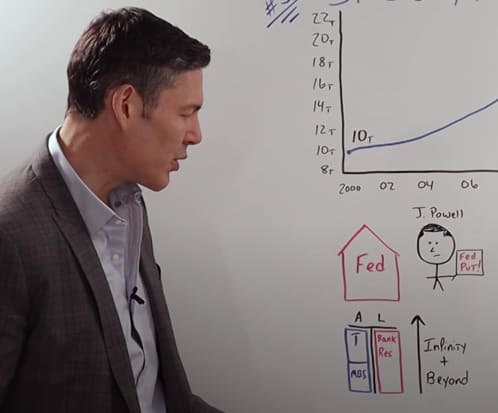 “Listen, we will do anything to support the market. Don't you worry? There is a Fed put. We will take our balance sheet to infinity and beyond.”
Even though they're just buying Treasuries and mortgage-backed sausages from the primary dealers like they have been since 2008, there's really nothing new.
Market Psychology – The Ultimate Driving Force
But in a way, it's a self-fulfilling prophecy, because the market and the participants think in their head, that the Fed has their back and what they're doing actually creates the market going up, and it doesn't.
Whatever the Fed does, doesn't literally make the stock market go up. It's a result of what the participants in the market actually do.
So when Jerome Powell comes out on 60 Minutes and says,
“Listen, we have your back,” the primary dealer banks, the guys on CNBC, that say, “Buy, buy, buy, buy, buy,” even this guy right here that looks exactly like Robin Hood; he's got his arrow and bow.
Even he is saying, buy the dip, along with, of course, your friend and family member, Fred, the financial institutions and hedge funds.
They're all buying because they think the Fed can actually manipulate the market. The only thing the Fed is manipulating is their psychology.
They're all buying because they think the Fed can actually manipulate the market.
We can see that this is just a game of musical chairs.
it's not going to last forever
So if you're asking how long can this last, I can tell you, it's not going to last forever.
I can't give you a specific date as to when it's going to end, but I would point out that back in March, we started to see chinks in the armor of the Fed.
Remember when they would come out every single day and say they were doing another round of quantitative easing, another round to the repo market, or some other four-letter, five-letter program, and the market would still go down.
It wasn't until the government came in with the stimulus package that the market started to go back up.
Can The Government Continue Spending All This Money?
So then your next question of course is, “Well, George can't the government continue to spend all this money? Can't the Fed just monetize their debt to limitless amounts?”
And you would be right, but I would also remind you of what we've been talking about right here.
And if we are under the assumption that inflation has been at least 5% on average since 2000, if you would have had money in the market for the last 20 years, your purchasing power actually would have gone down, not up.
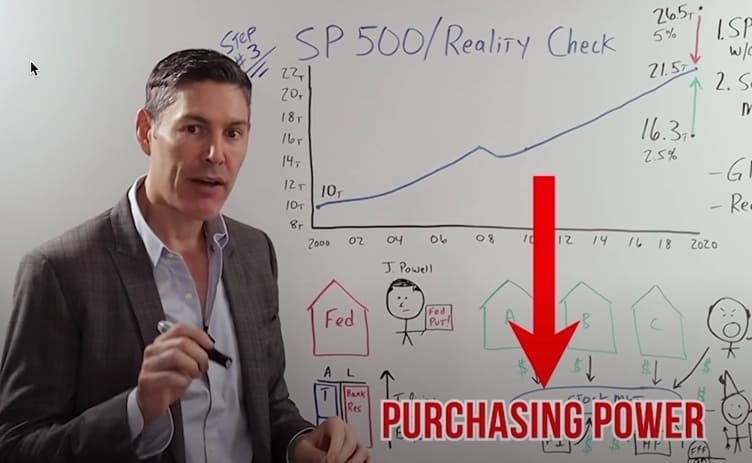
So remember, it doesn't really matter what the stock market does in nominal terms. It only matters what it does when adjusted for the real rate of inflation.
It goes back to what I say in all my videos. You shouldn't be investing with the mindset of is the market going up, or is it going down?
Or is a specific asset, is the price going up or down?
What you should start with, is asking yourself, if it's cheap? If it's cheap, then you go ahead and buy it.
If it's expensive, you sell it. If you continue to do that, buy low, sell high, over the long run, you're going to make money even adjusted for the correct rate of inflation.
Comments are closed.