Is the American dream of buying a home turning into a nightmare?
Governmental regulations keep on increasing, the homebuilders are unable to make a profit because of them, and the average joe's income is decreasing while the housing market prices are going through the roof. What solutions do we have and what should we expect?
In this article, I will explain all about it.

Do you want to take your investing to the next level? Check out my new Online Investing Forum! I have partnered with Lyn Alden and Chris MacIntosh to bring you the best investment tool on the Internet Today – Rebel Capitalist Pro! Check out our 7-Day Trial Membership Promo for only $1! Visit GeorgeGammon.com/pro.
For more content that'll help you build wealth and thrive in a world of out of control central banks and big governments, JOIN our Daily Newsletter for FREE.
Shocking Data

Let's go right to the charts. This one shows home prices in the United States adjusted for inflation. It starts in 1990 and goes all the way to 2019.
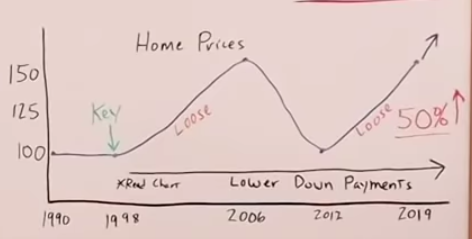
On the left, there’s a percentage from 100% up to 150%, and I want to point out that 1998 is key.
The reason the chart I drew only goes back to 1990 and the typical chart that I use goes all the way back to 1900, is you'll notice the prices from 1900, all the way to 1998, adjusted for inflation are pretty much the exact same.
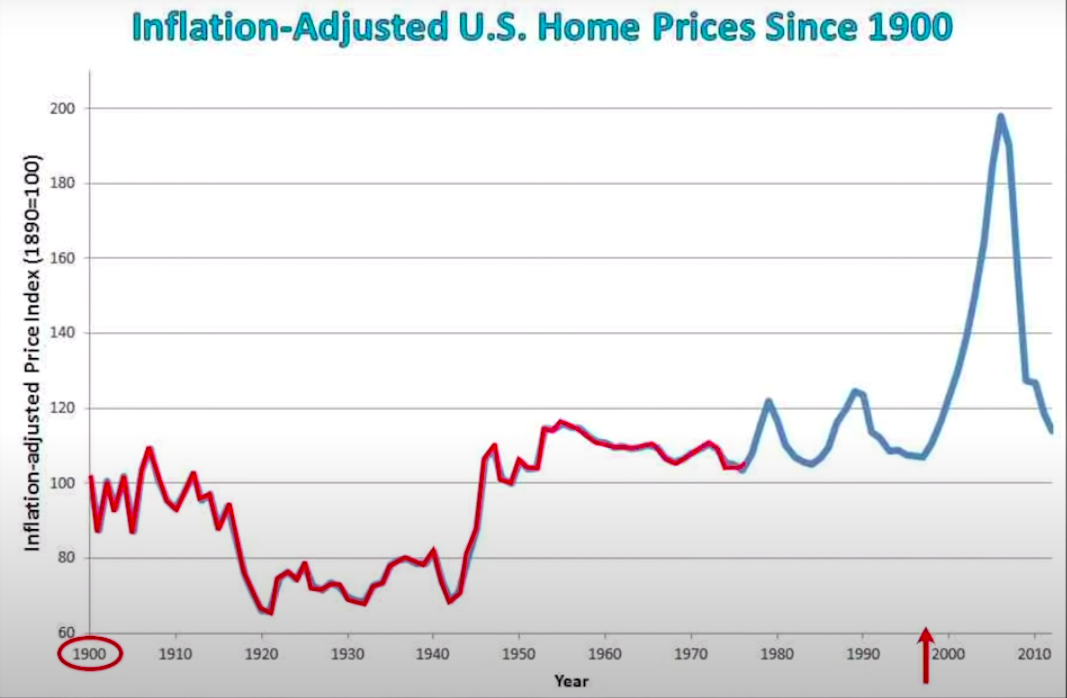
I'm going to start in 1998 because that's when housing prices go berserk.
We all know what happened. Lending standards decreased, home prices went up and we got a massive bubble that peaked out in 2006 and came crashing down in 2012, oddly enough, you'll notice it did almost right on the historic trend line going back to 1998 and all the way back to 1900.
Since 2012, prices have continued to go up to where in 2019, they were just as high as they were in 2006.
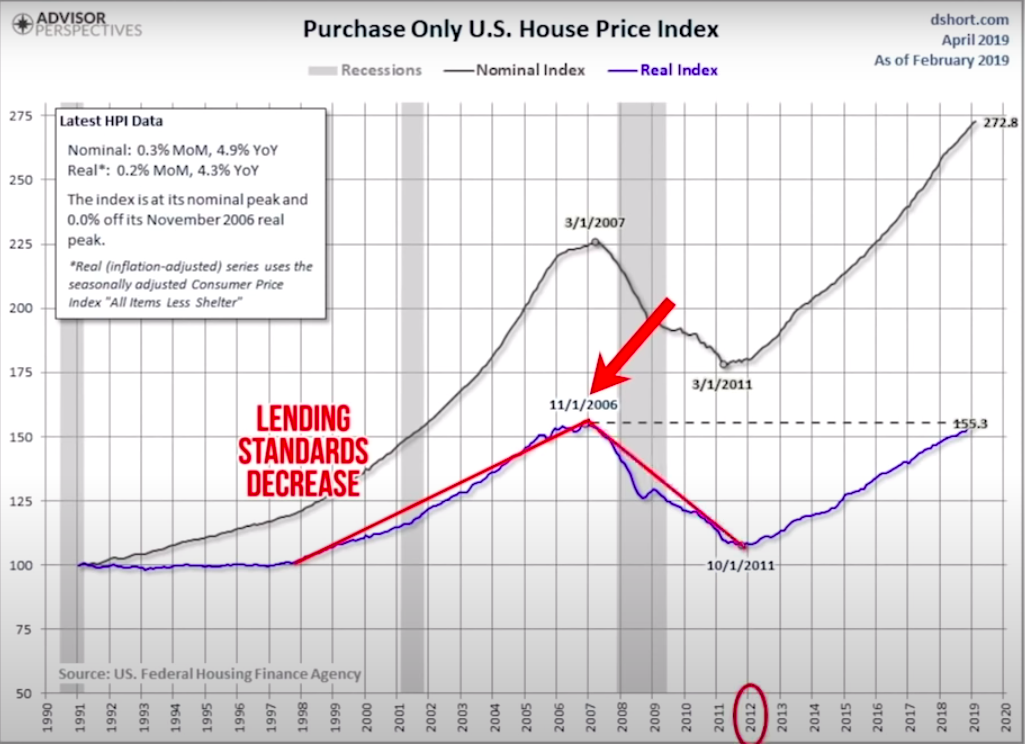
In 2020, they're even higher. Anyone that would argue that we're not in a housing bubble right now would also have to argue that we weren't in a housing bubble in 2006. I think that's a pretty tough argument to back up with the data.
Now, let's move on to the next chart. The average income of the middle class going from 1990 to 2019.
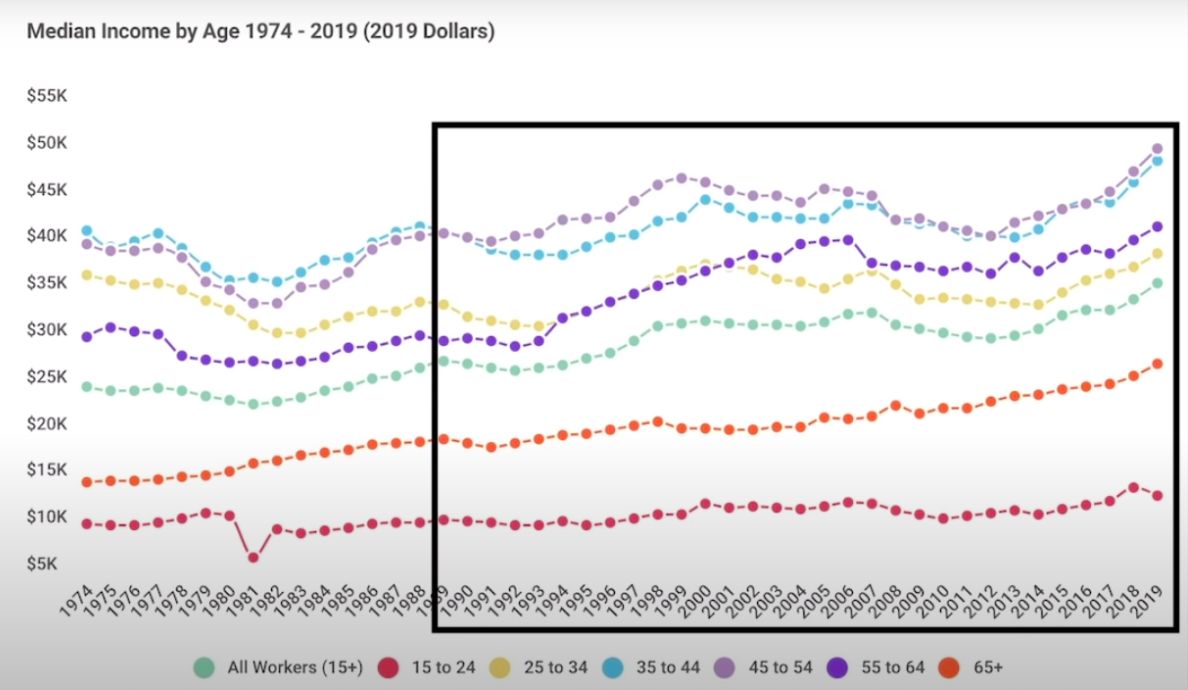
This chart is adjusted for inflation and it starts at $5,000 a year and goes up to $40,000. In 1990 the average income was right at about $25,000.
During 1998, the key year, the average was right around $30,000, after that, it went up and down a bit to where we were in 2019 at $34,000.
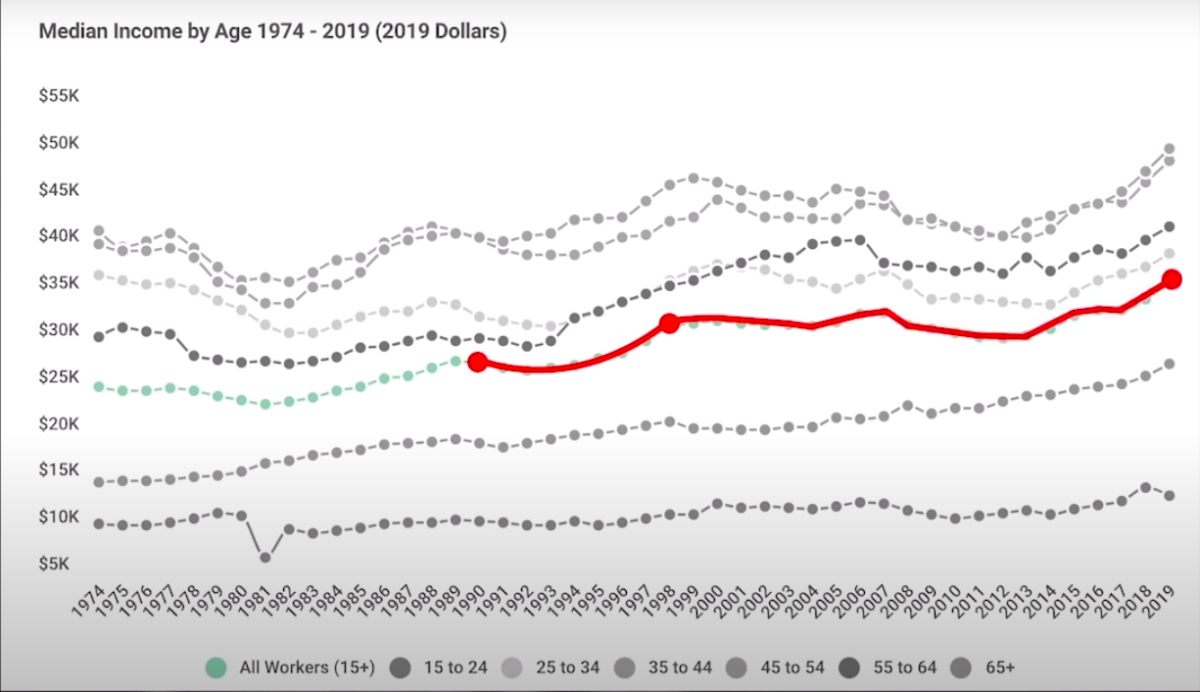
You'll notice an increase of $4,000 or 13% adjusted for inflation, but home prices from 1998 to 2019 have gone up by over 50%.
-
How on earth can that happen?
-
How can we have incomes only go up by 13%, but home prices go up by 50%?
As most of you would guess, it starts with interest rates.
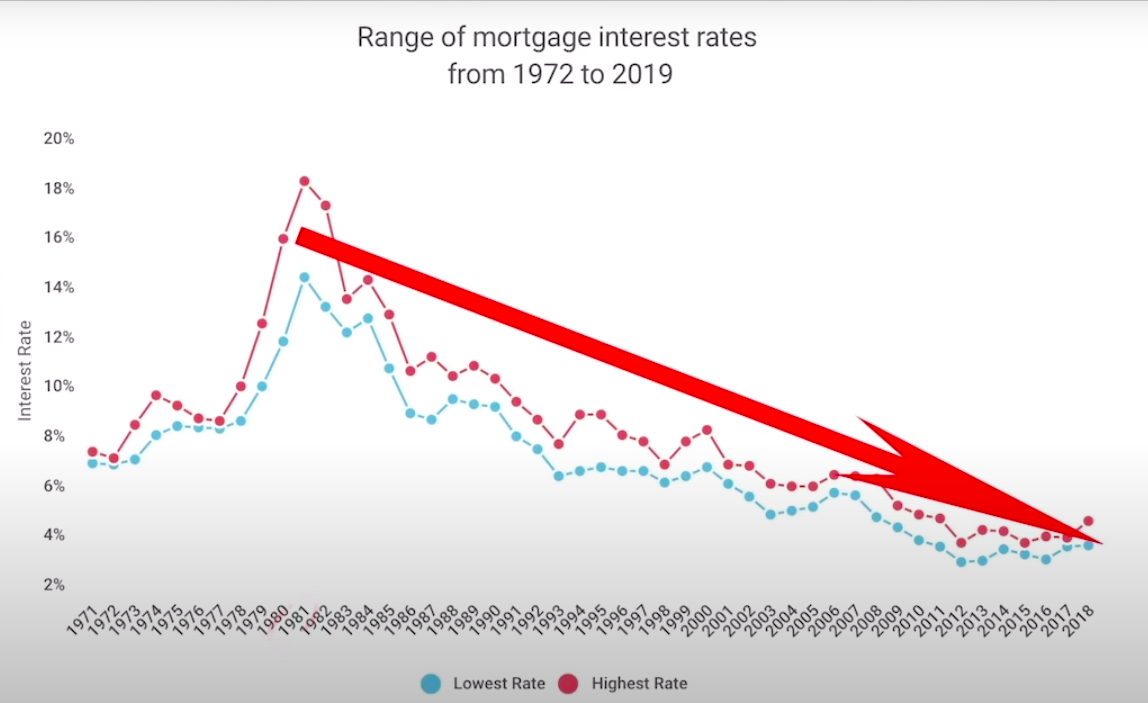
Mortgage rates since 1981 have gone down consistently. For the past 40 years, we've been in a down cycle of mortgage rates.
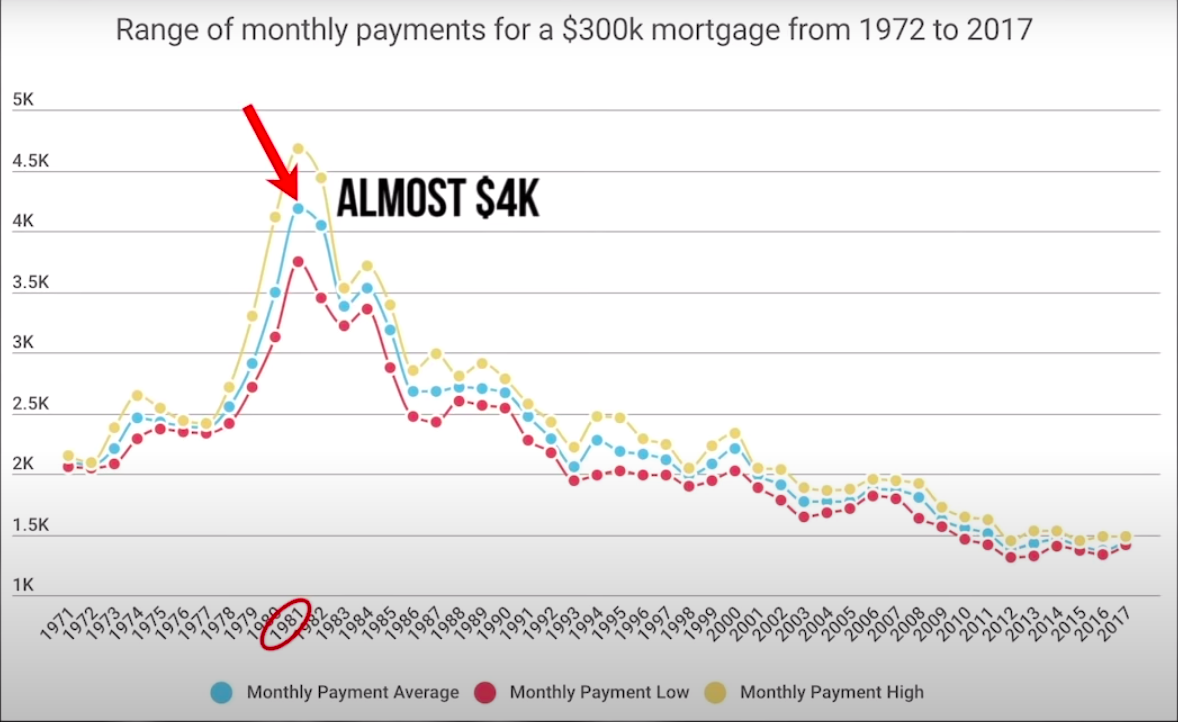
To put this into context, if you would have purchased the equivalent of a $300,000 home back in 1981, your mortgage payment would have been almost $4,000, in some cases, even higher than $4,000.
But today, to buy that $300,000 house, your monthly mortgage payment would only be $1,500.
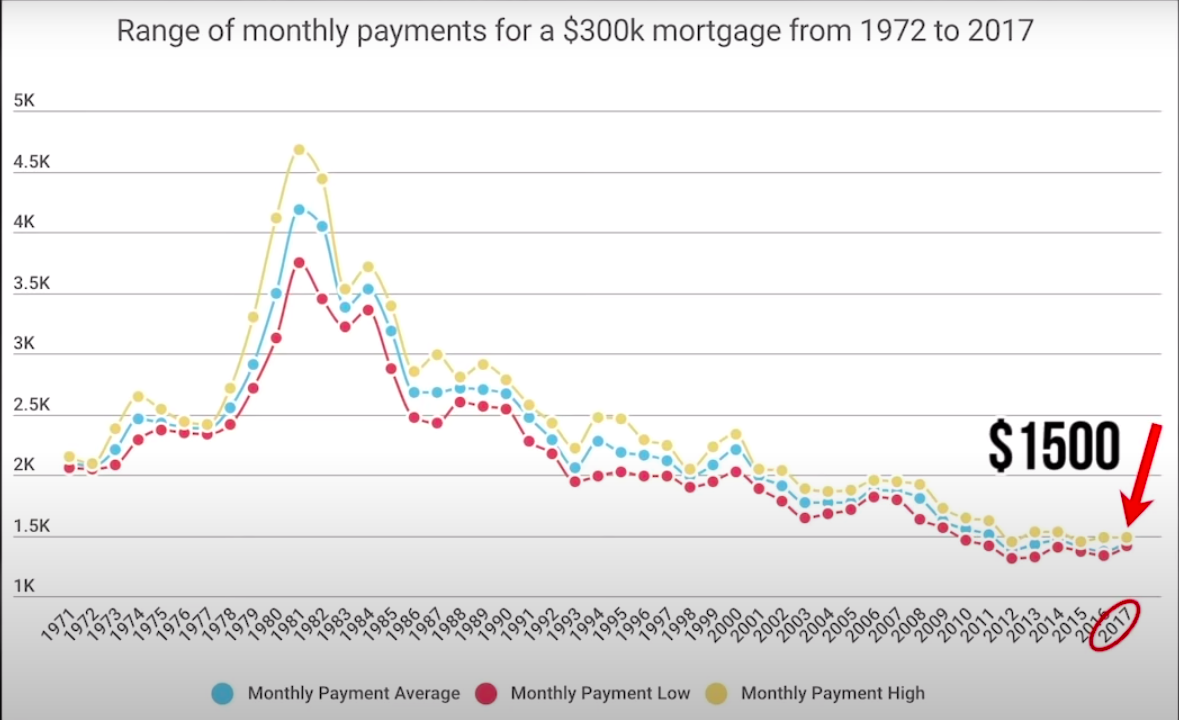
That's what gives the average American that much more purchasing power to afford higher and higher prices.
But it doesn't stop there, that wouldn't explain everything because mortgage rates went down dramatically from 1981 all the way to 1998 and housing prices were pretty much flat.
The same thing from 2006 to 2012, mortgage rates went down dramatically in that timeframe, yet prices went down. So we have to take it a step further, dig a little deeper.
To do that here is some info I found on a website called marketplace.org.
On it, Susan Wachter, a professor of real estate and finance at the University of Pennsylvania's Wharton School described the history for down payments of housing in the United States.
According to Wachter, before the 1930s most mortgages were short-term and non-amortizing. A home buyer had to either pay off the whole house in a lump sum, after a few years or roll over the loan at a new rate of interest. Down payments, on the other hand, were typically more than 30%, she said.
“After the result in foreclosure and construction halt- similar to what happened after the recent financial crisis- the government created the Federal Housing Administration or FHA, which backed mortgages, but required a 20% down payment.
After World War II, the Department of Veterans Affairs and the FHA adopted a 30-year fixed-rate standard. By the mid-1950s, most mortgages fit that description” Said Watcher.
“Since the 1950s, 20% has remained the average down payment with the exception of the run-up to the financial crisis in 2008. But how did 20 % become that dividing line in the first place, back in the 1930s? As with so much of our economic life, it's anybody's guess.” She explained.
In other words, the down payment to buy a home in 1998 was always around 20%, if not, higher throughout US history.
Then, in 1998, the amount of down payment required as a percentage got lower and lower. We can see that in the following down payment trends chart.
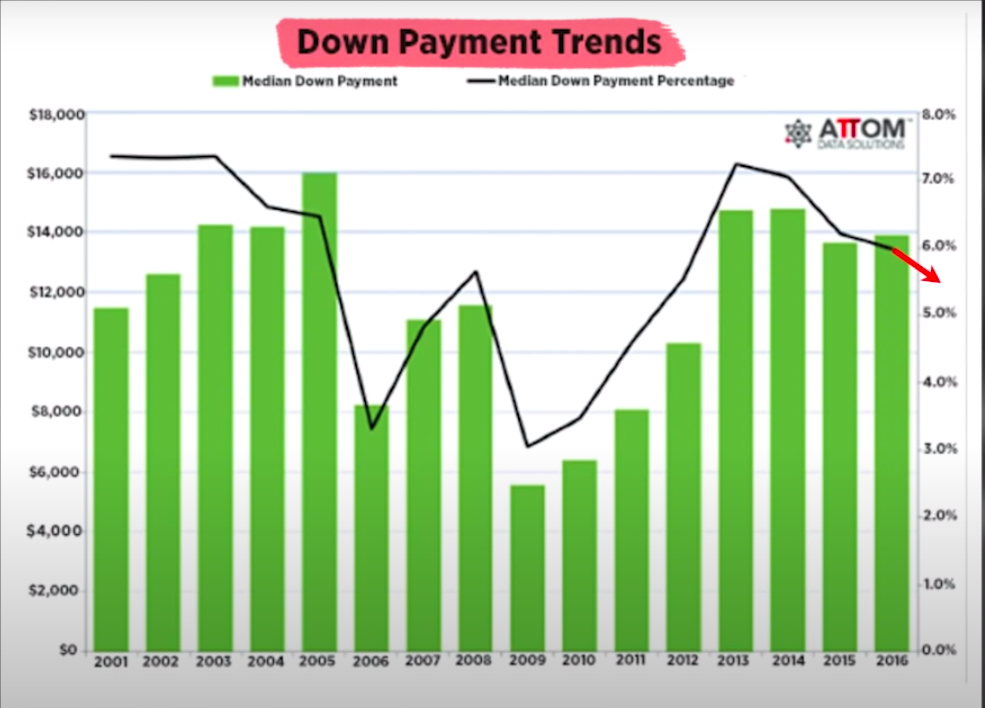
It starts in 2000 at about 7%. From 1998 to 2000, they'd gone from 20% all the way down to 7%, and bottomed down around 4% in 2006. No surprise there.
But I'd like to point out that from 2013 to 2016, where this chart ends, the required down payment got lower. It went from 7% to 6%, and I would assume the down payment is even lower today in 2020.
But the main takeaway from this chart, that I think is crucial, is we realize that the down payment required running up to the bubble in 2006 was between 7% and 4%, way lower than the 20% that had been required historically.
Now, many people think that we're not in a housing bubble now because lending standards are so much more strict, but the data doesn't back up the narrative when we can see that the down payment required today is still around 6%.
Most people that are bullish on the housing market and have claimed that lending standards are a lot tighter, make it seem as though the average down payment now is the same as it was back in the good old days, of 20%, but that's just not true.
It's nowhere close to 20%. It's 14% lower, all the way down to 6% and very similar to the way it was between 2004 and 2006.
Now you may be saying to yourself, “Yeah, George, I get it. But I kind of understood that before, and although the data is disturbing, it's not exactly shocking.”
Oh, you just wait… There is more.
This is the key that nobody is talking about and you need to understand to make sure that you're protecting your financial future.
Here is a chart of the price per square foot for new homes that are sold.
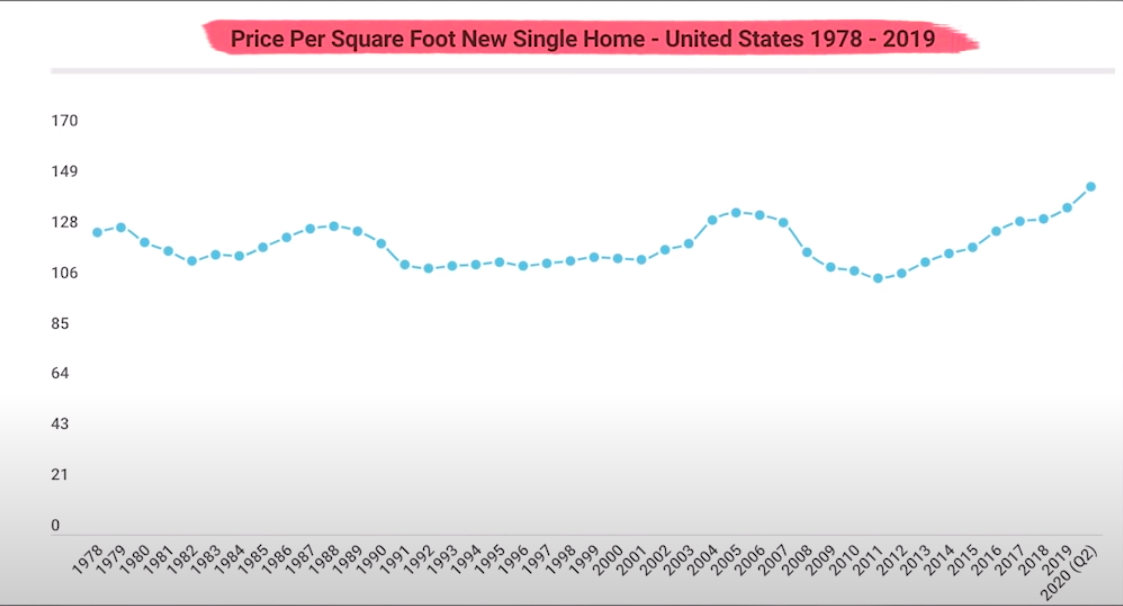
You can see this, as an aggregate total of home prices in the United States, has gone up by 50% like I said before.
But look at the square foot price. It started off about $115 in 1990, and this is adjusted for inflation. It went up a little bit, came down and back up, but it hasn't gone up close to 50%. It's only gone up maybe 20% or 30%.
This makes sense when you look at the next chart, which is the average home size of a new home in the United States.
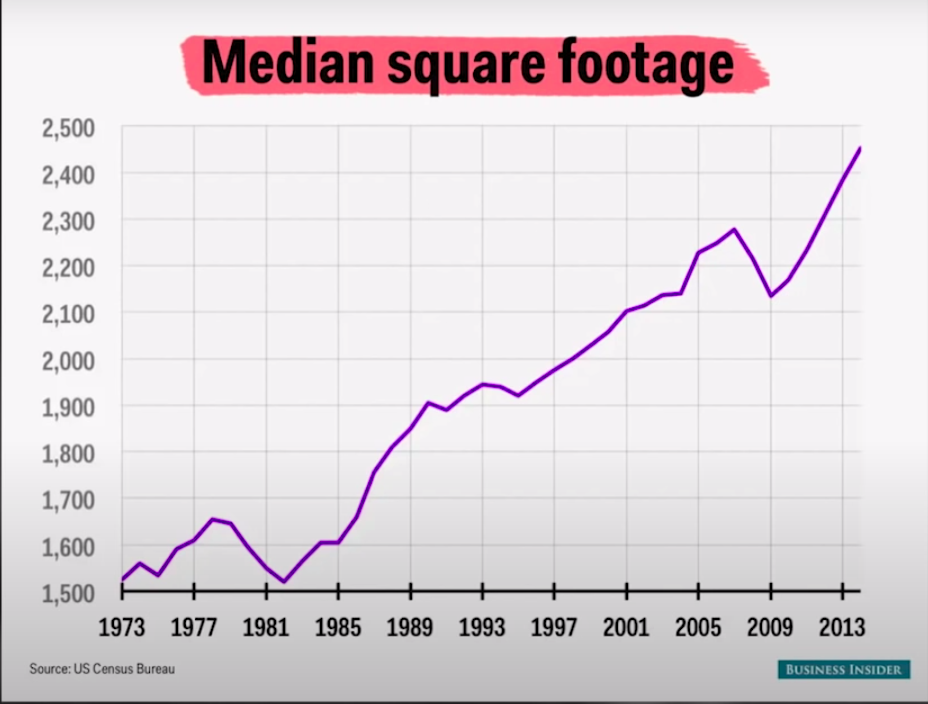
This chart goes from 1973 to 2013, and on the left, it goes from 1500 square feet up to 2500 square feet. In 1973, the average new home built was about 1500 square feet.
You can see that today, in 2020, it's all the way up close to 2500 square feet, and it's going higher and higher.
Understanding these dynamics is the key to understanding why the housing market, which is usually the American dream, is going to turn into the American nightmare.
Connecting The Dots

Now it's time to start connecting the dots, so we can see how this might play out long-term. I mentioned before that the only homes that are being built right now to a certain extent are larger homes that are getting larger.
-
Why are the home builders doing this?
-
Why wouldn't they create smaller homes that are more affordable?
Well, it's going to go back to their regulations, their costs increasing and their profits going down.
-
If you're a home builder, why would you consciously make a decision to build a bigger home?
Because that's the only way that you can make a profit.
All these politicians come out and like to demonize home builders as if they just don't want to create affordable housing.
People say things like “They don't want to do it. They're just mean. They're these greedy capitalists that just hate poor people.” That's not true.
The only reason they don't create affordable housing is because they can't make a profit. So the houses continually get bigger as the regulations go up.
We can see this illustrated very well in areas like Houston versus Los Angeles.
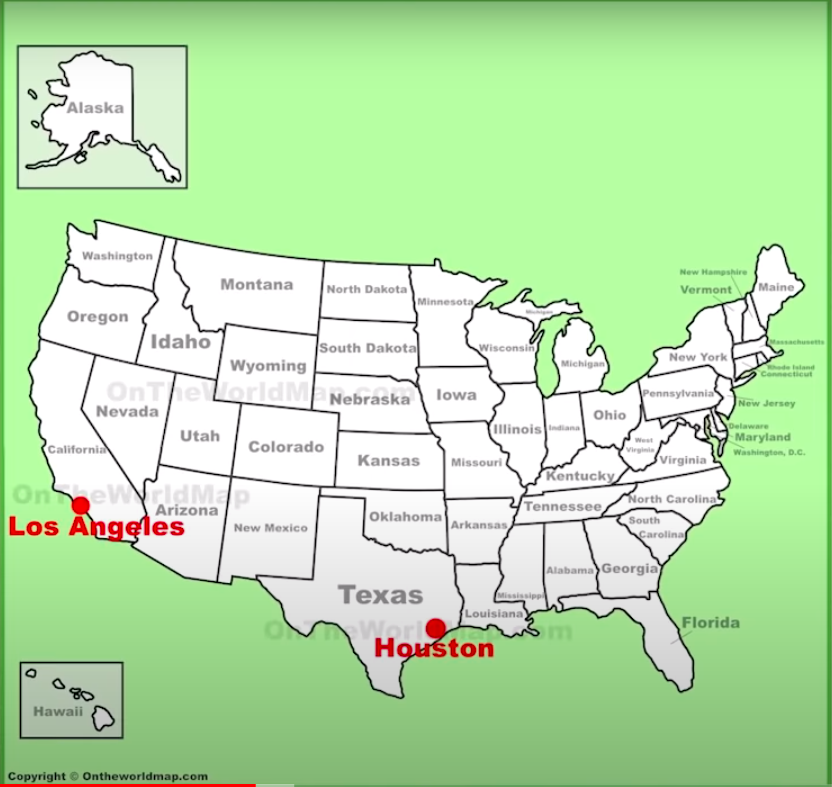
Let's go to a recent Forbes article that discusses this in more detail.
According to Forbes:
Government-caused artificial scarcity is the main reason why, according to the U.S. Census Bureau, California has the nation's highest Supplemental Poverty rate at 19% proportionately 29% higher than a place like Texas. That the average rent in Houston is $996 versus Los Angeles where the average rent is $2,420. This illustrates a big challenge for the working poor.
Tho that quote I would add the middle-class as well. A lot of people right now, like your friend and family member, Fred, would say, “Yeah, George, but everyone makes more money in Los Angeles so it all works out.” Not really.
Look at the income figures. People in Houston on average make almost as much money as people in Los Angeles and other big cities in California.
It's not an income issue. Again, it's a regulation issue. If you get rid of the regulations, let the home builders build, there'll be plenty of supply to keep prices down.
I can confirm this with my own personal story. I've built homes from scratch, specifically, in Portland, Oregon, back in 2014.
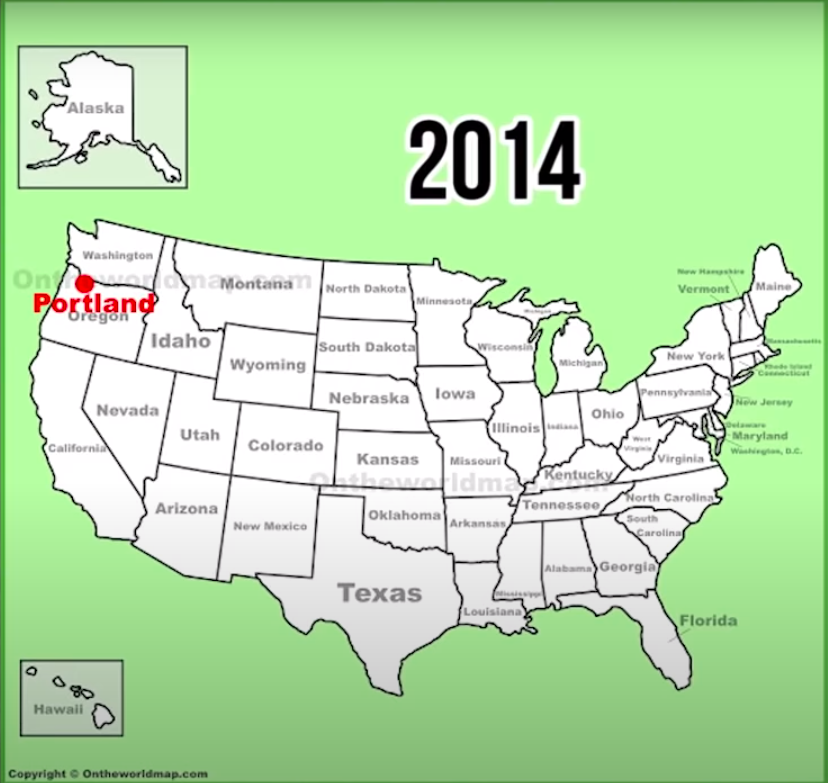
I purchased a lot right in the middle of the town. It was a bigger lot and I subdivided it. On one of the lots, I built a brand new home. The city came to me and hit me with regulation after a license.
They went so far as making me pave the road in front of the house just to get the permit to build, as though that was my responsibility. But it got even crazier than that.
There was at least $50,000 worth of additional fees just to start the building process above and beyond the license.
So what I had to do was sit down with my architect, go through the numbers and figure out how big the house needed to be, for me to actually squeak out a profit.
As a result, the house had to be over 2500 square feet.
I can tell you that from personal experience. All I have mentioned is what's going on in places like California, Oregon, Washington, and all of the urban areas that are leaning left.
Again, I disliked the right just as much as the left, but the bottom line is the left favors these restrictions that make housing prices go up.
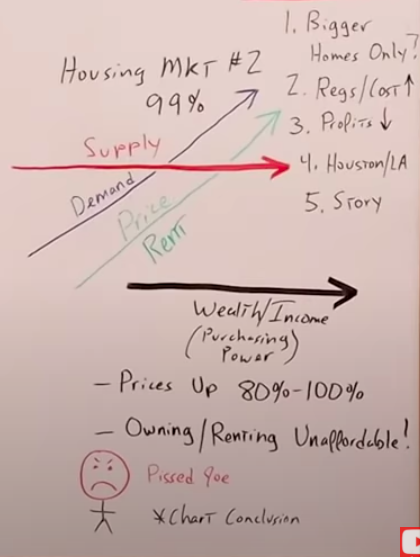
The bottom line here is the housing market has really been divided into two completely separate components. I like to think of it as the housing market one and the housing market two.
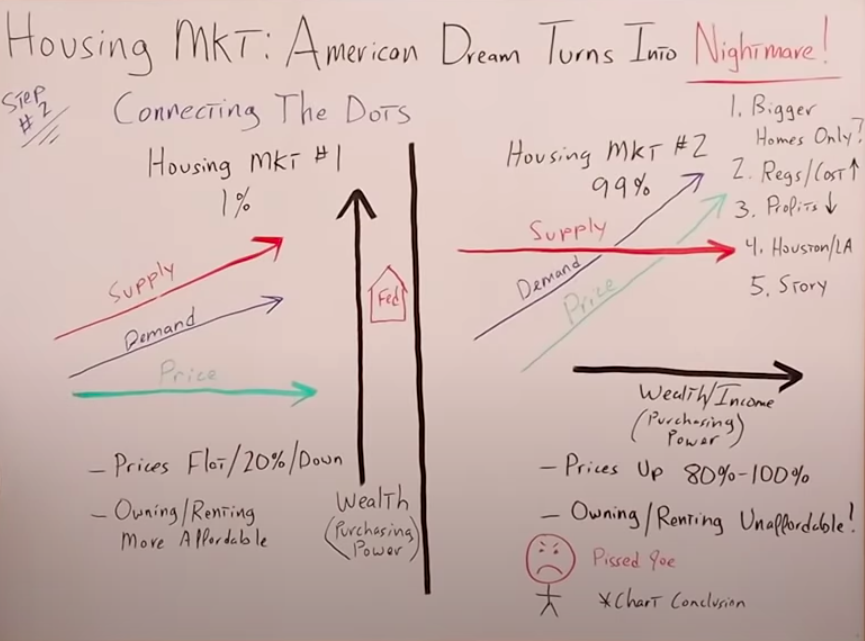
Housing market one is specifically for the 1% of earners. Housing market two is for the rest of us, the 99%. If builders are only building bigger McMansions for the rich because that's the only place they can make money, the supply is going to continue to go up.
It's going to track demand, if not exceed demand. Therefore, the price per square foot would stay pretty flat, and we saw that in the past charts.
On the flip side, we have housing market number two for the other 99% of the people where the supply is staying the same.
There are no more homes being built, yet demand is increasing substantially because the population is growing. Therefore, the price per square foot goes up.
But let's remember what's happening…
The wealth of the 1% of the population is increasing dramatically because of the Fed's quantitative easing, money printing, and the driving of the stock market higher. That's their game plan.
The wealth or the purchasing power of the rich in that 1% of the population increases while the price they're paying per square foot stays the same.
Of course it's the opposite for the other 99% because their wealth and income is staying flat, if not going down. So they have decreased purchasing power while at the same time, their price per square foot continues to go up.
That's why, if we look at the overall numbers, we might see that housing prices have gone up by 50% adjusted for inflation, going back to the US Price Index chart.
But really if we get down to the nitty-gritty for the rich, their prices have remained flat, maybe up 20% or down in some areas while for the rest of us prices have gone up by probably 80%, if not 100%.
Owning or renting for the majority is becoming completely unaffordable. We're owning and renting for the minority. The rich are becoming even more affordable.

What does this give us?
Not just the average Joe, but now the average Joe is pissed, rightfully so.
Here is a chart that illustrates exactly what I'm talking about. This is one of the more shocking charts I've seen in a long time.
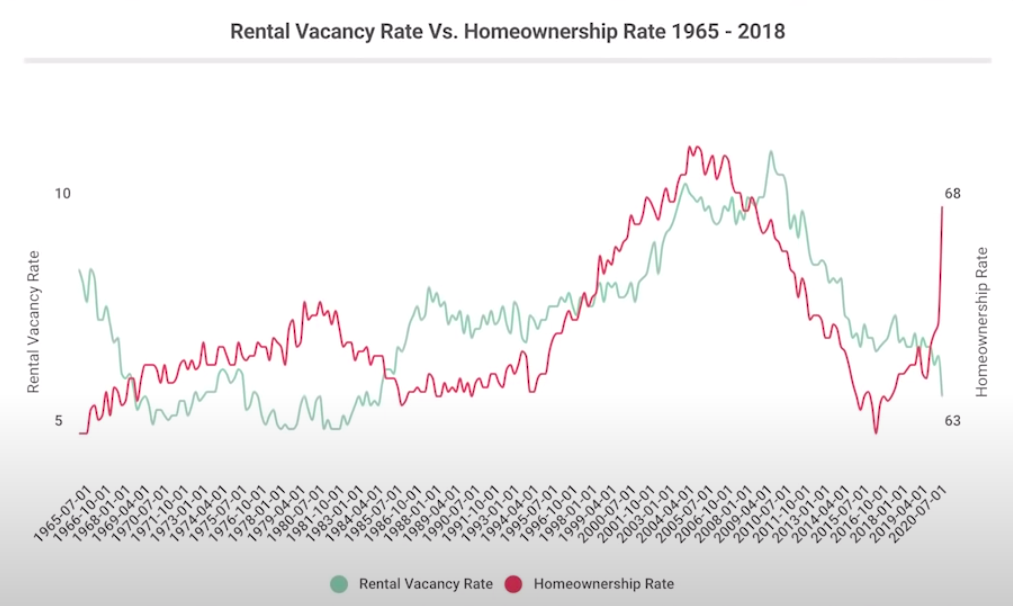
Usually what you have is if home ownership increases, then occupancy for rentals, of course, will increase as well because you have more people shifting over to either buying or renting.
Now, what we're seeing in 2020, especially is homeownership, is that it's going through the roof: 68%! While at the same time, the occupancy rates are plummeting. How is it possible that occupancy rates are plummeting while at the same time homeownership is going through the roof?
The only way that can happen is if there are more people that want housing and less housing actually available.
The Logical Conclusion

Unfortunately, I don't like to say this because I'm an American, I always root for the United States, but the only thing I see playing out long-term is a massive increase in homelessness.
Again, I don't like to say that, I'm just calling a spade a spade. For those of you who think I'm being a little hyperbolic, let's just walk through the logic.
Going back to where I was connecting the dots, remember the wealth and the income or the purchasing power of the 99% is pretty much staying the same, if not, decreasing while at the same time prices and rents are going up because demand is increasing with the population.
But the supply is staying the same, if not going down, because we have no housing stock that's being built at this price point or at this size.
Unfortunately, if the price is going up and wealth stays flat, if not going down, the outcome is going to become more and more people that can't afford to put a roof over their head.
California is a perfect example of this. Look at a recent chart that shows how unaffordable this area actually is for the people living there.
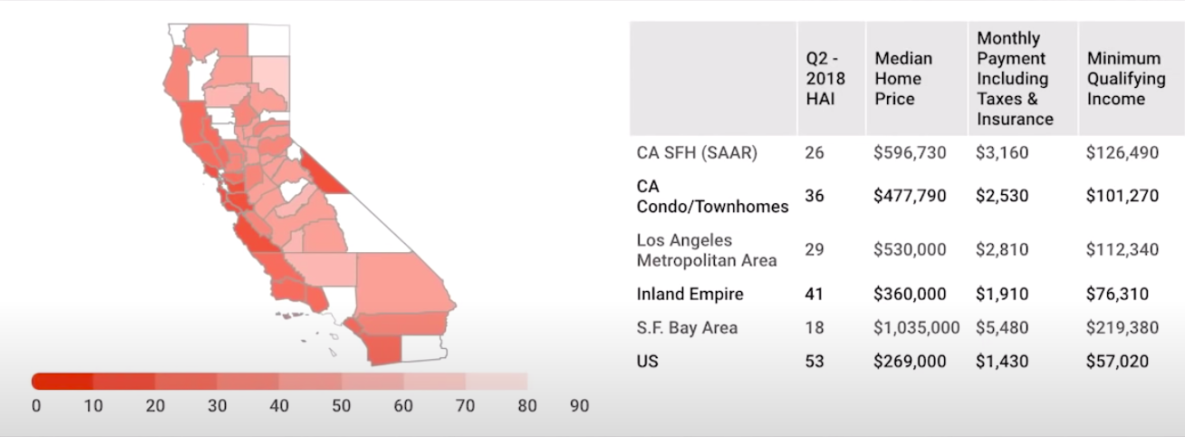
The median home price in California is around $596,000, almost $600,000. That's a $3,000 a month mortgage payment.
To qualify for this, you have to be making $126,000 a year. Not exactly the middle-class. Now, look at San Francisco, just to afford the average home there, you need to be making over $200,000 a year and the mortgage payment will be almost $5500 a month.
Unbelievable if you compare this to the rest of the United States where you only need an income of $57,000 to be able to afford the average home.
We know that this is not a result of higher incomes, it's a result of higher regulations and increased costs for builders.
We can also compare Houston with San Francisco or Los Angeles, but I want to pull up another chart of the number of homeless people per 10,000 residents.
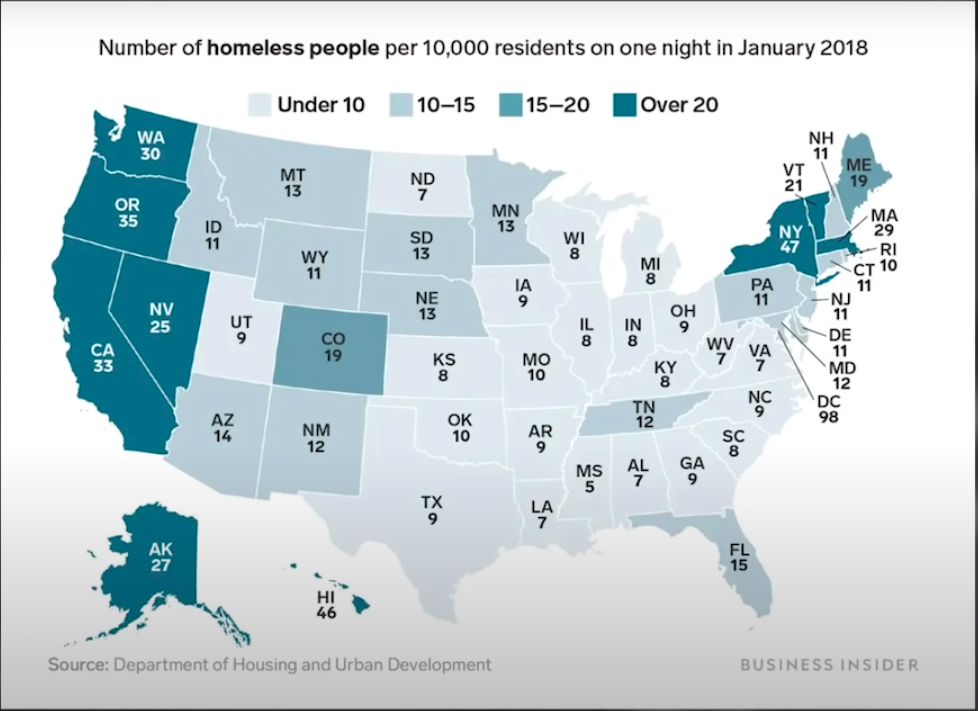
It would come as no surprise that California is almost on the top of the list, at 33 homeless people per 10,000 residents.
But the common denominator that you see with States like Washington, Oregon, California, Hawaii, and New York is extremely high building regulations which make it cost-prohibitive for builders to build “affordable housing” or smaller sized homes.
Compare that with a state like Texas, Louisiana, Alabama, Georgia, where it's very easy to build a house and very affordable to buy or rent. Therefore, you can see very few homeless people.
Unfortunately, I don't think it ends with just an increase in the homeless rate in the United States.
Remember we have drugs that are being legalized and I'm all for legalizing drugs, but the bottom line is if you put more drugs out there, you're going to have more and more people using them.
Especially if we have an increase in homelessness and we have an increased unemployment rate, long-term stagflation due to the coronavirus and everything that's going on with the economy.
We have structurally high unemployment long term. We most likely have higher drug use and we have housing becoming more and more unaffordable. Of course, the situation just gets worse.
We also have this push, the societal narrative towards defunding the police. So let's think this through.
You have a higher rate of unemployment, more homeless, more drugs, and less police, that equals Gotham City.
You're going to have a massive increase in crime, unfortunately.
What are some potential solutions?
I'm sure right about now your friend and family member Fred is saying, “Yeah, George, I get it. Those States do have some problems like California, Washington, Oregon, but their politicians are so forward-thinking. They're so progressive that they're going to come up with an outside of the box solution. You're just stuck in the past. You, Austrians, are just too stubborn. You libertarians, progressives, and the socialists. They're going to come up with a plan to eradicate homelessness, just you wait and see.”
As you would expect, their main solution is to build housing for all of the homeless people, state-funded housing projects.
But a lot of these politicians are coming to the realization that due to their own policies that restrict builders from building more housing stock and affordable housing, ironically, prevents them from building more homes as well.
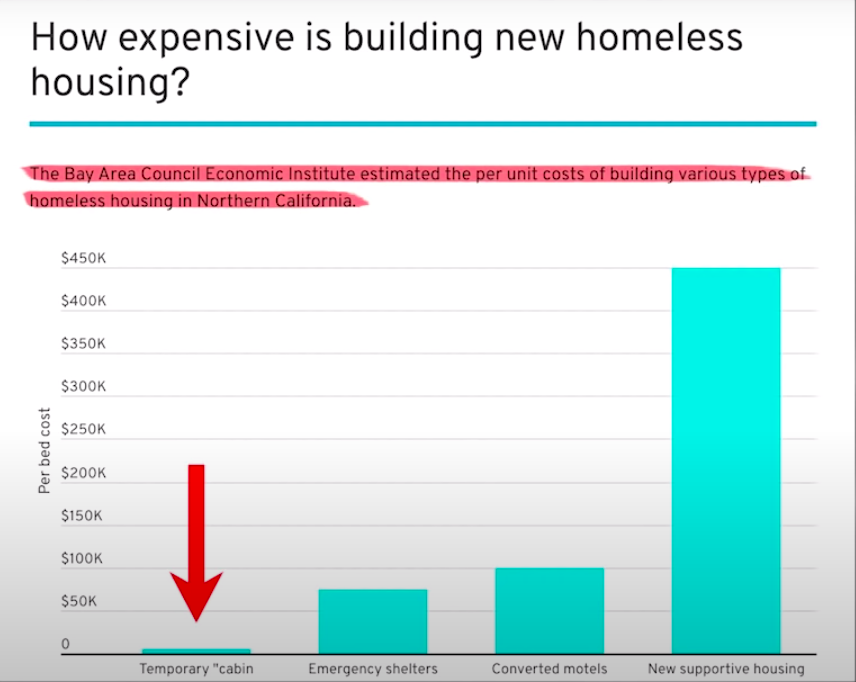
The Bay Area Council Economic Institute estimated the per-unit costs of building various types of homeless housing in Northern California.
It starts with a temporary cabin, which I think would be totally adequate, but of course, the politicians on the left think that's totally “inhumane” as if it's better for the homeless people to be sleeping in a tent on the sidewalk.
Even emergency shelters clock in around $75,000, converted motels at about a hundred thousand and keep in mind, this is per unit, not for the entire converted motel.
I have no idea how it would be possible to spend a hundred thousand dollars to convert one motel room into a living space for a homeless person, but leave it up to California to make it happen.
Then if you just build them a brand new house, the price clocks in at about $450,000 grand. I hate to make light of it and laugh but I think it's so ironic that these politicians are getting a taste of their own medicine.
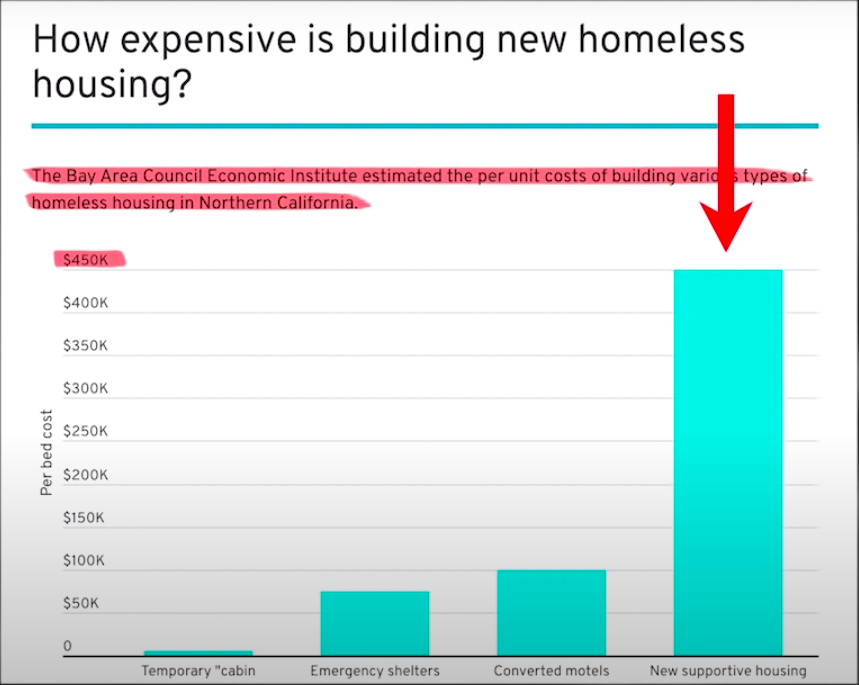
Now they understand what it's like for these builders to try to build “affordable housing” when they have so many regulations. To just build one house it costs $450,000.
To give you some perspective, usually a house, just a simple house would cost maybe $150 a square foot minus the land. So if you think a thousand square foot house costs $450 a square foot to build, that is all land and/or regulation.
The same group that put out this chart, notes that there is one problem:
Permanent supportive housing is really expensive to build. In Los Angeles, a recent estimate from a city auditor put the median cost of building one unit at more than $530,000. A new project coming on line in San Jose is estimated to pencil out at roughly $470,000 per unit. The outrageous price tags aren't just driven by land costs. It's a shortage of construction labor and a prolonged city approval process are also to blame.
But take it from me, someone who's actually built houses from the ground up in areas like Portland, Oregon.
The shortage of construction labor is not the main problem. It's the outrageous land prices created by all these crazy building codes, and all of the regulations brought down by the local governments.
State housing is not a viable option unless they want to increase taxes even higher, which would drive more taxpayers actually out of the state. They would be shooting themselves in the foot.
They're backed into a corner where they really don't have any options. The other thing they could do, of course, is lower regulations so the free market could come in and actually create housing at a profit.
I don't see that as probable, unless you get crazy politicians or unless the narrative in States like California, Oregon, and Washington do a complete 180-degree change, probably not likely in the near term.
You could see people solving this problem by having more and more individuals living in the same square footage, very similar to what they do in Europe and South America but that means the standard of living is going to continue to go down.
-
So what can you do?
-
How can you take control over your own situation?
The first thing is to be cognizant of what happens in the world around you. Don't go whistling by the graveyard, realize that if you live in one of these States, your state is moving in the direction of Gotham City very quickly.
Unfortunately, in this story, there is no Batman. It's only going to get worse if they continue to pursue these policies that got them there in the first place.
I would suggest considering polling the ripcord as soon as possible and getting out of dodge. I realize a lot of you can't do that because there are personal issues that are involved.
But I think as long as you understand what's going on and do what you can do to the best of your ability, you're going to be better prepared for the future to protect yourself and your family from what's going to happen.
That's going to be an increased level of homelessness, most likely drugs, and the crime rate going through the roof.
Unfortunately, this is the part of the housing market that nobody is talking about, but by reading my articles you'll understand that you need to start thinking these things through.
You need to understand the data to see where the puck is going in the future.