Federal Reserve Secrets You Need To Know
We’re in a type of scenario where each day the Fed announces more money printing, more bailouts, and more alphabet soup solutions.
Which is why we need to be prepared for the future of the economy. We are constantly led to believe the Fed has things under control, especially with the Effective Fed Funds Rate (EFF), but they really don’t.
The EFF is anything but calm and stable, and the Fed has no choice but to implement “money printing infinity”.

In this article, I will reveal three secrets about the Fed that will shock you and it’s crucial you understand them.
I will explain how the Fed can’t let interest rates go above a certain level, why they don’t control the EFF, and why they have no other choice but print money.
Federal Reserve’s “no Bueno zone” secret
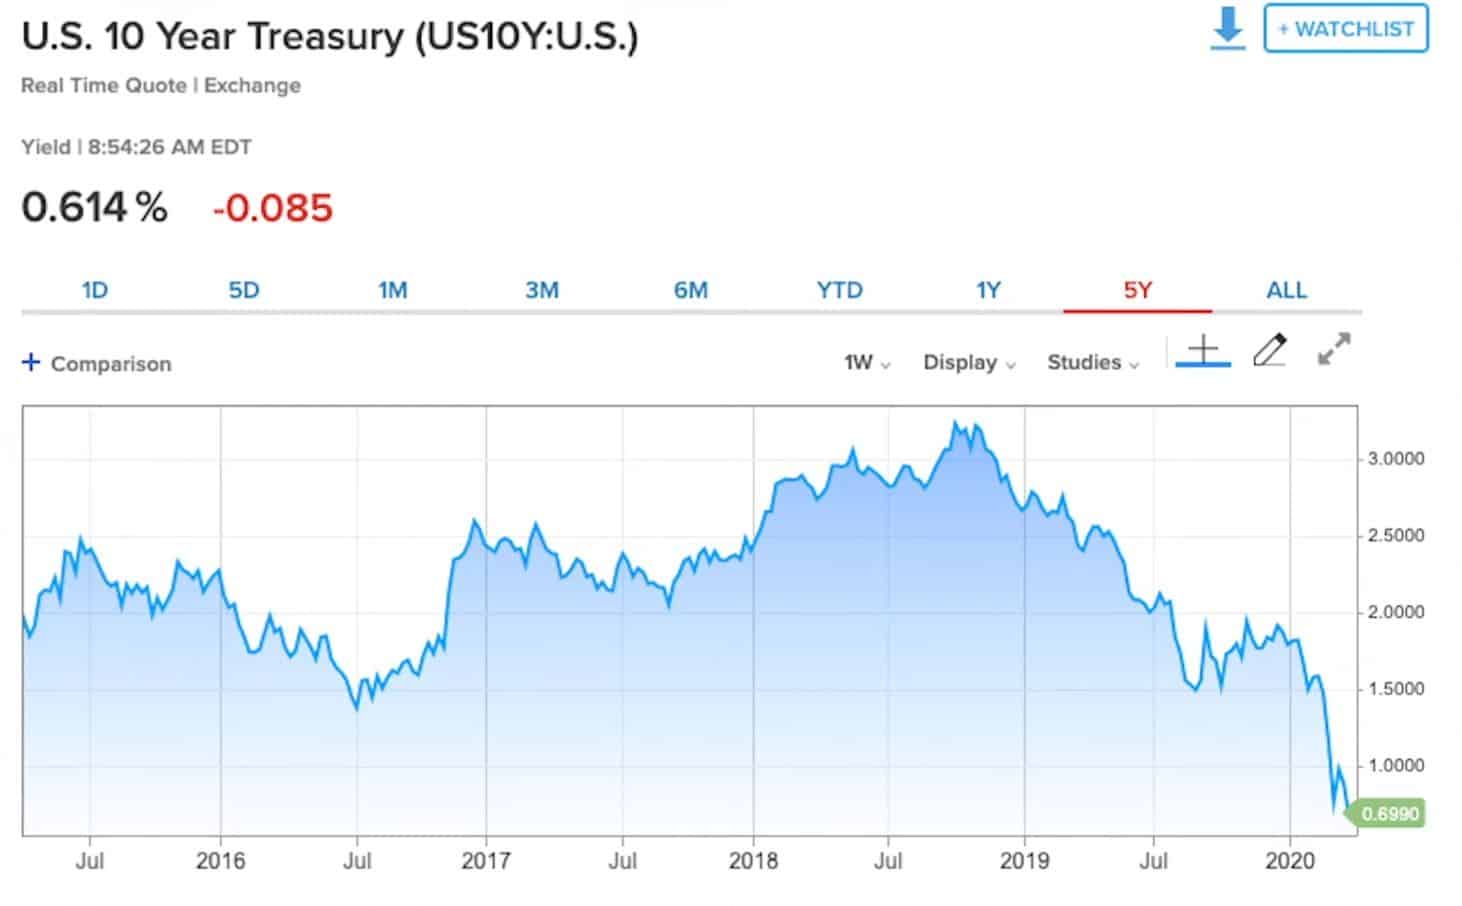
The no Bueno zone is a term I’ve created, and to comprehend what it is, let’s dive into a U.S. 10 year treasury chart.

Interest rates for these assets go from 0 to 3%, as shown in the chart.
This graph starts off in 2016 very flat and dips down around July. It came back up in 2017 and it stayed flat until 2018 when interest rates spiked to a peak in September (an important date I will bring up later).
Any interest rate above 3.5% in the 10-year treasury will crush the economy, which is why I call it the no Bueno zone.
If interest rates go above this level, we can get into an all-time high in consumer, corporate and sovereign debt, and when we have that much debt in the system, and an interest rate is a price or a cost of the debt, at a certain level, people won’t be able to afford higher monthly payments.
In September 2018, the S&P 500 completely crashed because interest rates got too high for the economy and the stock market to handle, so the Fed had to stop raising interest rates so the market could recover and interest rates in the 10-year treasuries could come down.
This way, the 10-year treasuries went down to where they are today, none other than at 0% because we went right back to ZIRP.
However, today, the no Bueno zone is a lot lower than it was since there’s more debt in the system, and because the longer interest rates are kept at zero due to ZIRP, as they are today, the lower the no Bueno zone goes. Just look at Japan.
Additionally, we had the Fed increased its balance sheet (BS) from $4 trillion to $5.5 trillion.
When we have the expansion of the money supply in the Fed’s BS along with ZIRP, and additional debt in the system, the no Bueno zone will continually go down until at some point it gets to zero.
This is what the Fed doesn’t want you to know.
Still, I have more great news! The Fed came up with a new four-letter solution called FIMA!
Foreign International Monetary Authorities Repo Market (FIMA)
They’re not only intervening in the domestic repo market, but they’re also creating another repo market outside the United States.
Meaning, a global repo market.
I invite you to read the Fed’s official announcement posted on their website.
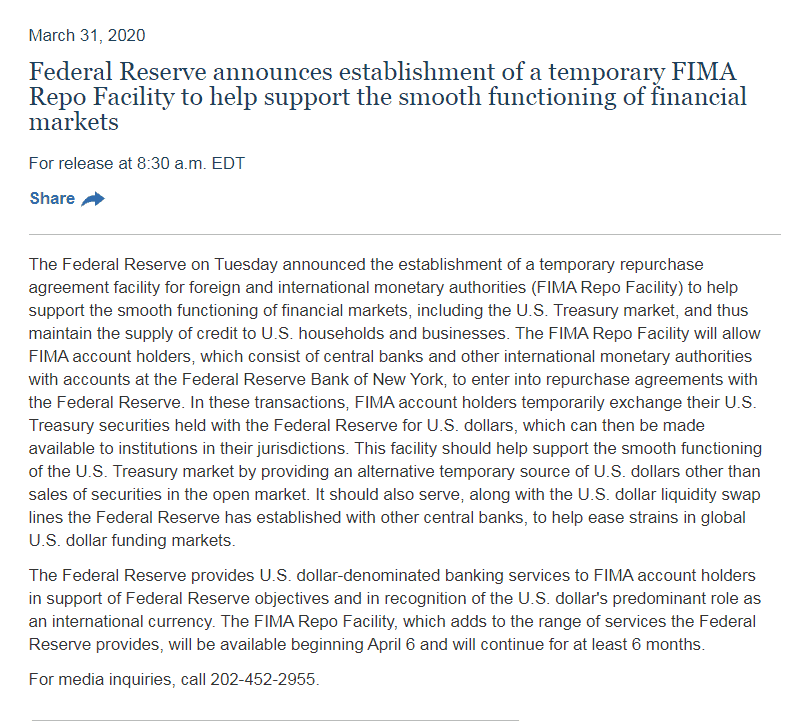
Notice it says:
“This facility should help support the smooth functioning of the U.S. Treasury market by providing an alternative temporary source of U.S. dollars other than sales of securities in the open market.”
But, before I explain why this is important, I will give you a quick review of the domestic repo market so you can better understand this solution.
The Fed prints money and gives it to the primary dealers and banks under its umbrella in exchange for collateral in the form of treasuries or mortgage-backed securities.
If it’s overnight and they swap back the very next day, it's an overnight repo, but if it's longer than one day and it lasts for 14, 30 or 54 days, it’s considered a term repo.
What the Fed has done with FIMA is set up a repo market outside the United States with the central banks of other countries.
Let’s say there are three different countries, X, Y, and Z. On the asset side of their BS, they have treasuries, and on the liability side, they have dollar-denominated debt (DDD), and debt denominated in their local currency.
What’s happening to these countries is they’re having to come up with dollars to make the payments on their DDD and to do so, they’re selling treasuries to the treasury market.
But, the Fed is asking them to stop doing so since they created a repo market just for them so they can give the Fed the treasuries in exchange for the dollars they need.
The Fed is doing this because if those central banks or corporations who have treasuries outside of the United States sell them into the open market, their supply will increase.
If treasury supply increases, the prices will go down and interest rates up, potentially taking us to a no Bueno zone.
So with FIMA, the Fed is doing everything they can to make sure no one, literally, in the entire world, is selling treasuries.
They want all those assets on their BS so the interest rates won’t go up potentially taking us to the no Bueno zone because nobody is selling the treasuries nor the supply is growing.
But, again, that’s what no one is talking about and what the Fed doesn’t want you to know.
Federal Reserve’s insiders secret regarding the Effective Federal Funds rate
This is the second secret I can guarantee you’ve never heard of.
The Effective Federal Funds rate (EFF) is a range, currently, between 0% and 0.25%, but for my explanation’s sake let’s pretend it's between 1% and 2%.
This is an aggregate total of all the Fed funds transactions that happen during the day, but to make this clearer, we can take a look at a chart Jeff Snider sent me.
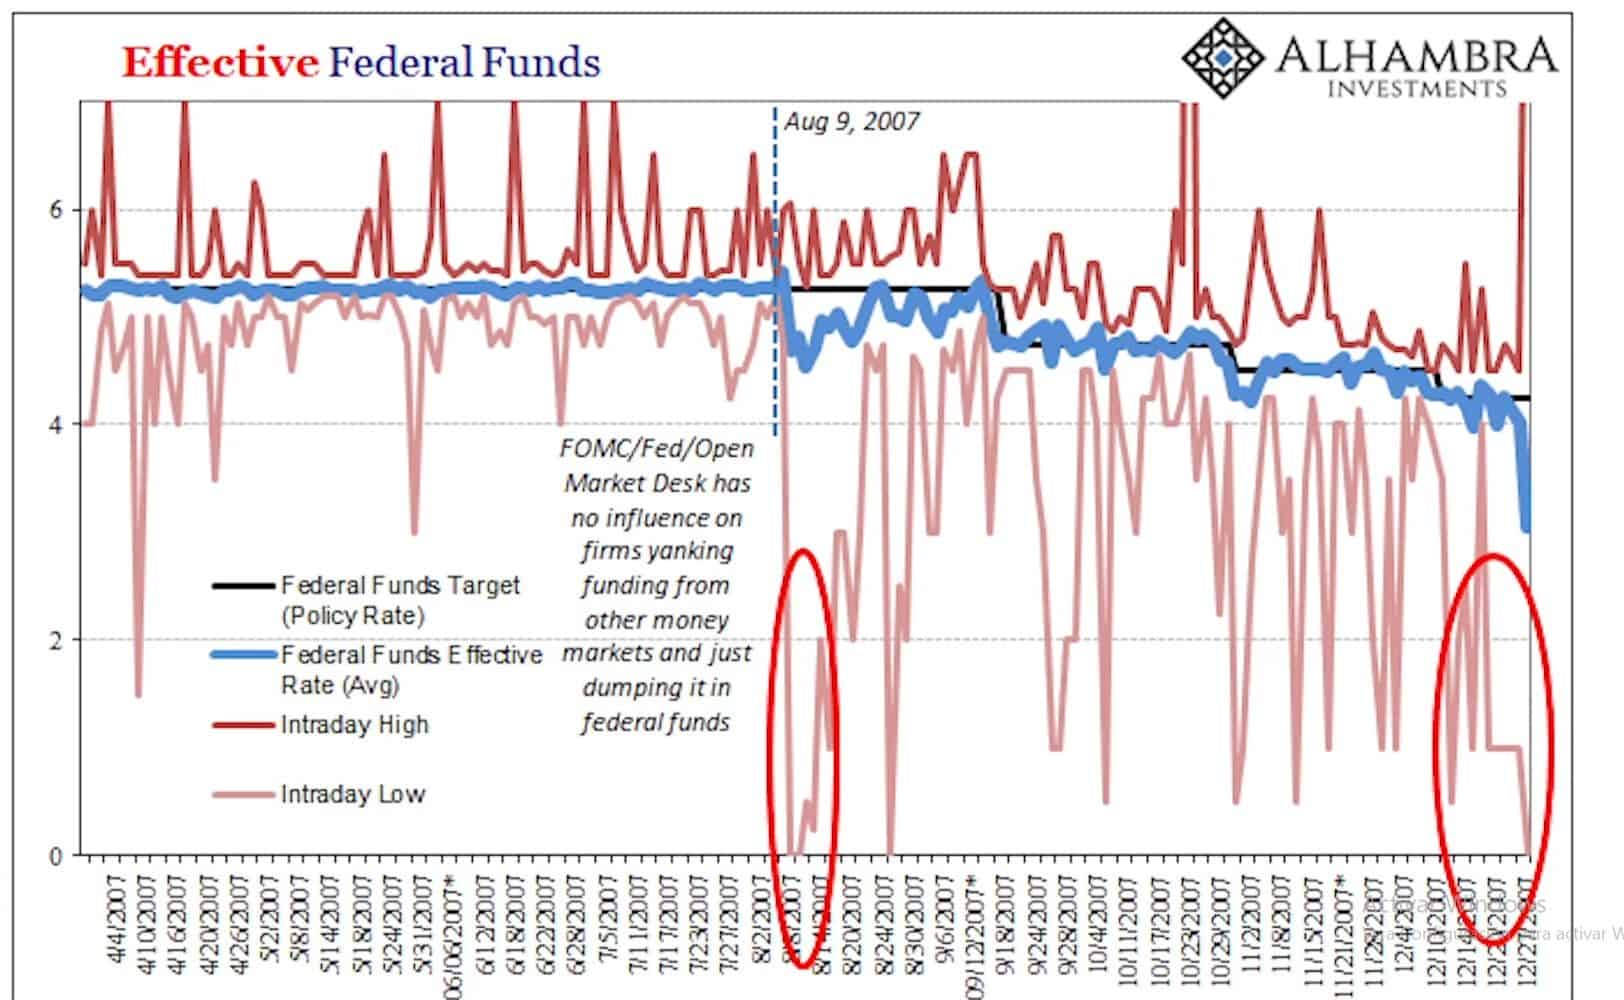
The blue line represents the fund's rate for the particular date, but you can see throughout the day with all the banks, there were transactions that happened way above or below the given rate.
This means things are extremely volatile behind the scenes, even though what people see on the Federal Reserve’s website is just one simple number.
So if the fed funds rate is, again, as an example, between 1 and 2%, the Fed will publish a number like 1.1%, and people might think there’s a lot of liquidity in the system because the number is at the bottom of the Fed’s range.
However, what people don’t understand is in order to get 1.1%, there were thousands of transactions that could’ve occurred below 1% or above 2%.
In Jeff Snider’s words:
“We have to realize something like Federal Funds don’t have a single rate, I know an Effective Federal Funds Rate is what gets published in the papers and on the internet, but there isn’t a single rate that applies to every transaction happening during the day.
It’s just an average to all sorts of transactions and funding trades that go on across a whole range of interest rates, interest costs, and volume. It’s different for every counterparty that shows up looking for cash at the Federal Funds.
So, we start out with the Federal Funds market to understand the Effective Federal Funds Rate is a weighted average of all the transactions that do take place”.
Expressed in a different way, we need to understand the Federal Funds transactions happening throughout the day can be wildly different in terms of the interest rate we see on CNBC or on the Fed’s website.
I want to remind you how these transactions take place.
There are primary dealers and ordinary banks, if we look at the second’s balance sheets we might notice they have differences in terms of cash, but let’s just assume they all need funding or extra cash to operate.
To get this cash they go to the fed funds market.
The primary dealers, who lend the money to the ordinary banks, can see each one of them with a little bit different counterparty risk, so they might charge a higher interest rate to some of them.
On a day to day basis the lending would look like what I’m about to show you, but, let’s suppose the primary dealers will lend money to three banks.
Remember with this example, we’re assuming the fed funds range is between 1% and 2%.
Day 1:
Bank #1 gets their money at a 2% rate
Bank #2 gets it at 1.5%, and
Bank #3 gets it at 1%
This means the Effective Fed Funds rate for the day would be 1.5%, right in the middle of the range.
So if an economist were to tell you about the liquidity needs for the day, they could say it wasn’t as bad because it was in the middle of the range, which means there was most likely plenty of liquidity or cash for all the banks who asked for it.
If the interest rate would’ve gone to 2% or even out of the range, like it did when the repo rate spiked on September 17th, then they would say there wasn’t enough liquidity in the system for all the banks.
The less cash there available, the higher the price goes.
Moving on day number 2, we’ll suppose there was a lot more perceived risk than it was on day number 1.
So If there’s more risk, the primary dealers don’t have to lend to any of the banks beneath them.
Day 2:
Bank #1 didn’t get their money at any price.
This means there is more money for bank 2 and 3 because the primary dealers may see them as lower credit risk, especially on a day where maybe the market is crashing.
Bank #2 gets it at 1.25%, and
Bank #3 gets it at 0.75%
So the average of the total transactions for the day would be 1%, lower than it was on day 1, this would make some people say there was plenty of cash for all the banks, but we know by looking behind the curtain that’s the opposite.
The liquidity in the system got tighter even though the effective fund's rate went down.
Nevertheless, what does this mean to you and the average viewer?
This is the reason why gold and many other assets like Bitcoin and the Miners are being sold off, but because no one is talking about this secret, no one knows the main reason why this is happening.
If we go further and pretend bank #1 isn’t a bank but maybe a hedge fund, mutual fund or a huge investor with many assets going into the fed fund market on day 2, and they can’t get any money to pay their expenses or debts, they sell whatever is liquid on their balance sheet.
This is the main reason why this is important, but, we also need to understand that what we’re being told by the talking heads on CNBC referring to liquidity isn’t necessarily true.
I also want to point this out, if you’re dealing with the Fed or any of these markets, although they seem smooth and calm on the surface, underneath they can be extremely volatile.
Federal Reserve’s interest rates secret
They also don’t want you to know the interest rate on the 10-year treasury doesn't necessarily equal all interest rates.
Going back to what I said before when we analyzed the 10-year treasury chart, I used it to show you what interest rates were doing in the broad economy, but it doesn’t necessarily mean there’s a causal relationship.
In other words, if 10-year treasuries go up and down, it doesn’t necessarily mean other interest rates in the economy will go up and down in the same way.
Sometimes, they can move opposite to one another.
If we compare, for example, a mortgage-backed securities chart with a 10-year treasury dating back to September of 2018, we can see many differences.
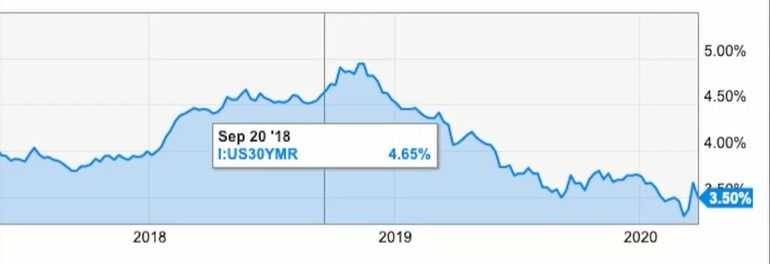
As you can see during September, October, and November, rates were significantly different, in the same period of time, they moved opposite one another.
So our question should be, what affects other interest rates, different from the 10-year treasuries?
What affects the interest rates of mortgage-backed securities?
Two things: Inflation and the additional supply of treasuries in the market because the Fed has to print more money to buy the treasuries and keep interest rates low.
Therefore, the market sees this as potentially inflationary, and we know this is true just by looking at the chart of all quantitative easing rounds.
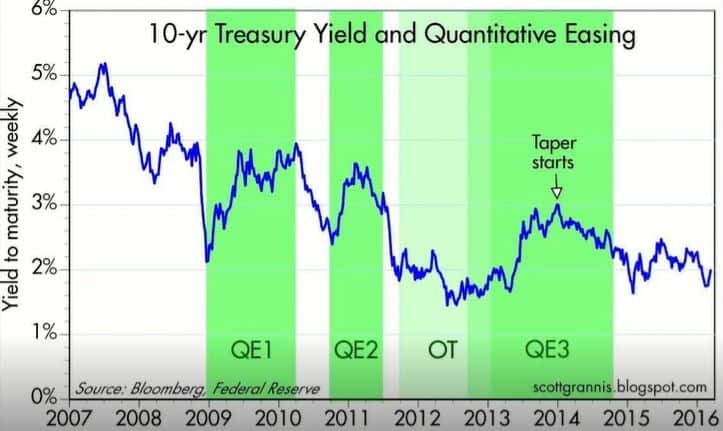
As you can see, when quantitative easing is done, 10-year treasuries go up.
So, what makes interest rates of assets like mortgage-backed securities go up?
Is buying all the treasuries the only way the Fed has to control the long end of the yield curve and maintain them low?
Chris Macintosh answers:
“I think there are only two ways out of it, one of them is what you mention, but that presupposes there is a buyer for all the debt they issued.
If there are no buyers, they have to come into the market and move into a Japanese type of situation where they control that side of the market.
The other way is that when you move down that path, where they’re monetizing the debt to keep the yield curve under control, the impact is seen on particular asset classes, in terms of inflation.”
That’s to say what drives interest rates higher are inflation expectations in the marketplace.
As I said before, there’s a no Bueno zone for the 10-year treasury, but there’s also a no Bueno zone for all markets that have interest rates.
Let’s pretend, hypothetically, for the treasury market the no Bueno zone is 2%, for the mortgage-backed securities market is 4%, and for the corporate bond market 5%.
If the Fed goes into the treasury market, like they’re doing with FIMA, and prints up more money, because there’s now a second repo market outside the U.S., this is going to be potentially inflationary.
Therefore, the market will see it as prices going up because there’s more money chasing the same amount of goods and services.
So if the Fed starts to inject liquidity into the treasury market, the inflation expectations in the corporate bond market and mortgage-backed securities market will increase.
Hence, if they also have no Bueno zones, where interest rates can’t go over a threshold, it means the Fed is not only going to buy all the treasuries to keep interest rates low but also all the mortgage-backed securities and corporate bonds.
This, in turn, creates a huge doom vortex in the sense that if the Fed is increasing the money supply, the market is going to see it as inflationary, which means they’re going to sell even more interest rate sensitive assets than they otherwise would have.
In other words, the more money the Fed prints to keep interest rates under the no Bueno zone, the more forced selling they’re going to create.
The more forced selling they create, the more money they have to print to buy more and more assets.
The higher the inflation expectations go, the more selling the marketplace does, consequently, the more money the Fed has to print.
Fed’s balance sheet would then grow bigger every time till infinity and beyond, and I’m not being hyperbolic here.
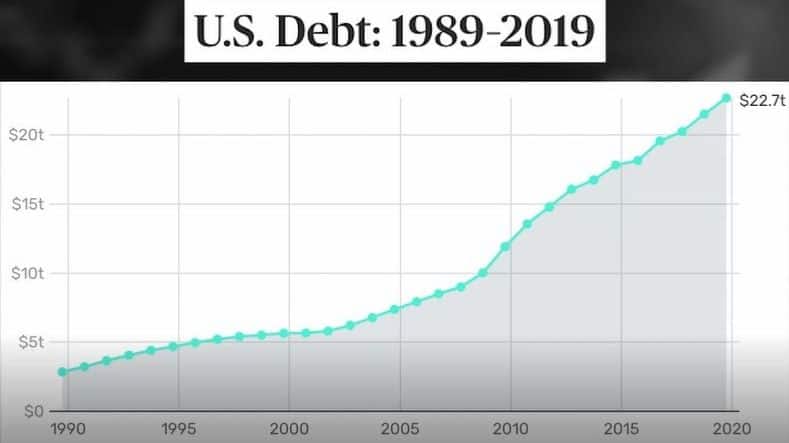
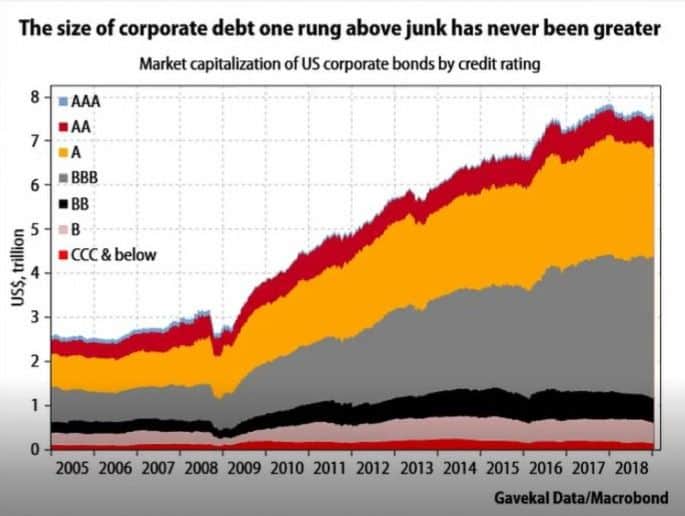
Please take a look at these charts.
The treasuries outstanding are around $23 trillion, the corporate bonds $7.5 trillion, and the mortgage-backed securities $8 trillion, this is taking the Fed’s balance sheet near $40 trillion, and this is without all the bailouts and four-letter solutions.
The final takeaway:
1. There’s a threshold for rates in all these markets, and the Fed can’t allow interest rates to exceed those levels without the entire house of cards collapsing.
2. Things like the fed fund rate which seem calm on the surface, but they’re extremely volatile.
3. The Fed most likely doesn’t have control over the short end of the yield curve and the fed funds rate, as we were told.
4. The Fed has no control over the amount of liquidity in the system at all. We are in a broken system, and the Fed will continue to struggle with the liquidity in all of these markets on a moving forward basis.
5. Because they can’t allow interest rates to go into a no Bueno zone, it’s going to be a monetary roach motel, as Peter Schiff said, you can check in but never leave. This is quantitative easing infinity, repo market infinity, stimulus infinity, and now, money printing infinity.